by Vera Pavlakovich-Kochi, Ph.D.
Senior Regional Scientist and Associate Professor of Geography
In 2006, the Mexican government merged two existing programs designed to promote exports, Maquiladora and PITEX (Programa de Importación Temporal para Producir Articulos de Exportación) into a single new program, IMMEX (Industria Manufacturera, Maquiladora y de Servicios de Exportación). The Maquiladora Program, initiated in mid-1960s as assembly platforms for U.S. manufacturing, continued to grow under the NAFTA, and by 2006 employed 1.2 million workers. PITEX was established in 1990 and by 2006 numbered 3,620 firms and included all motor vehicle assembly plants and most of their parts suppliers in Mexico. The overwhelming majority of Maquiladora plants, 82 percent, were located in border states with only 18 percent located in interior states. In contrast, the majority of PITEX establishments, 65 percent, were located in interior states and 35 percent in border states.1 Together, Maquiladora and PITEX establishments were responsible for more than 60 percent of Mexico’s total manufacturing employment in 2006.
IMMEX as a Source of Jobs and Foreign Currency Revenues
By 2014, the IMMEX program included 6,171 establishments with a total of 2,464,669 employees.2 The IMMEX sector is the second most important source of foreign currency in Mexico after revenues from the exportation of crude oil. In third quarter 2014, IMMEX sector revenues were approximately $7 billion, an increase of $0.5 billion over the previous year, in contrast, revenues from the crude oil exports declined by more than $1 billion in 2014.3 The significance of the IMMEX sector for Arizona’s economy is primarily as a destination for Arizona manufacturing products and as a market for Arizona business services. About 30 percent of maquiladoras in Sonora are owned by Arizona parent companies and through a production-sharing model remain competitive in global markets. Manufacturing establishments account for approximately 82 percent of the total number of establishments in the IMMEX program and 89 percent of total employment. Non-manufacturing activities, which include agriculture and mining, account for 18 percent of establishments and 11 percent of IMMEX employment.
Transportation Equipment Leads Manufacturing
Of the IMMEX manufacturing sectors, transportation equipment manufacturing, which includes Mexico’s burgeoning auto industry, is the strongest accounting for 16 percent of establishments, 32 percent of employment, and full 44 percent of total IMMEX manufacturing sector revenues. In terms of employment, the computer and electronic product manufacturing is in second place with 12 percent, while electrical equipment, appliance and component manufacturing follows in third place with 7 percent. Together, these top three sectors account for 51 percent of IMMEX manufacturing employment (Figure 1), 29 percent of establishments, and generate 51 percent of revenues.
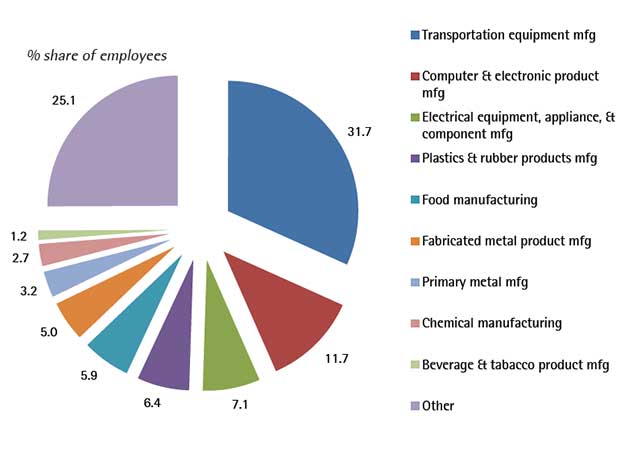
Figure 1: IMMEX Manufacturing Employment by Sector, 2014
Source: INEGI. Estadística Integral del programa de la Industria Manufacturera, maquiladora y de Serviciosde Exportación (IMMEX), Feb. 2015. Data are averages January-November 2014. www.inegi.org.mx
Agriculture Sector Leads IMMEX Non-Manufacturing Export Activities
Non-manufacturing activities in the IMMEX program include establishments involved in agriculture; mining (except for oil and gas); trade of agriculture and forestry materials; warehousing and storage; administrative and support services; waste management and remediation services, and other export-oriented non-manufacturing activities. Agriculture-based establishments account for 25 percent of all establishments, 51 percent of all employees, and 20 percent of total revenues, and thus represent the leading sector within the IMMEX non-manufacturing program. Administrative and support services include the second largest number of establishments, account for the second largest revenues, but trail the mining sector in number of employees. Figure 2 shows the IMMEX program employment by non-manufacturing activities.
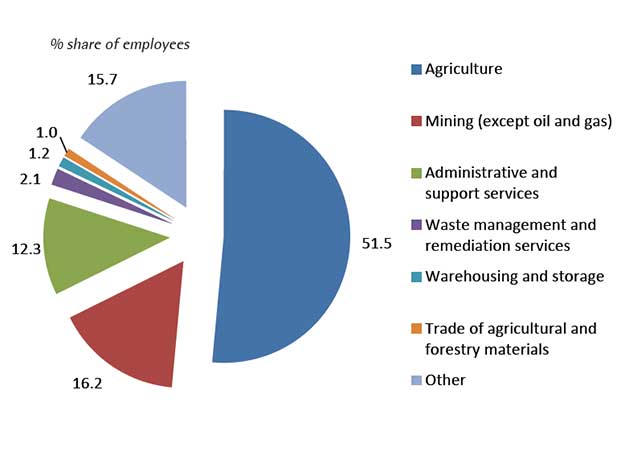
Figure 2: IMMEX Non-Manufacturing Employment by Sector, 2014
Source: INEGI. Estadística Integral del Programa de la Industria Manufacturera, Maquiladora y de Servicios de Exportación (IMMEX), Feb. 2015. Data are averages January-November 2014. www.inegi.org.mx
The inclusion of the auto industry (formerly within the PITEX program) and especially non-manufacturing activities is reflected in the more even distribution of employment throughout Mexico in comparison with the traditional maquiladora sector prior to 2006. Especially interesting is the rise of centrally located states Guanajuato, México, and Querétaro (Figure 3). However, Mexico’s six border states still account for approximately 60 percent of the IMMEX program’s establishments and employment. Baja California holds the first place with the largest number of establishments (about 18 percent of the total), while Chihuahua is number one with the largest number of employees in the Program (13 percent of the total). Sonora’s share is about 6 percent in both the number of establishments and number of employees.4
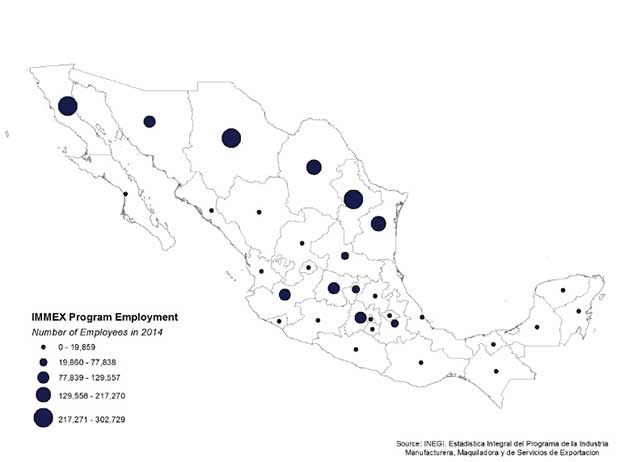
Figure 3: Concentration of IMMEX Employment by State (Manufacturing and Non-Manufacturing) 2014
Source: INEGI. Estadística Integral del Programa de la Industria Manufacturera, Maquiladora y de Servicios de Exportación
Sonora and Sinaloa Lead IMMEX Non-Manufacturing Activities
In 2014, Sonora’s IMMEX Program employed more than 163,000 workers, of which 113,000 were employed in manufacturing and 50,000 in non-manufacturing establishments. While Sonora trails behind the other border states in manufacturing activities, Arizona’s neighboring state holds the top rank (18 percent of Mexico’s total) in non-manufacturing activities. The state of Sinaloa, a major source of winter fresh produce to the U.S., had over 45,000 employees in the IMMEX non-manufacturing services category (17 percent of Mexico’s total). Together these two states accounted for more than a third of IMMEX non-manufacturing employment.
Arizona’s Locational Advantage
Since the inception of the maquiladora model more than 40 years ago, Arizona’s companies have had taken advantage of the geographical proximity to Mexico’s assembly/production plants, especially those located in the neighboring Sonora. Whereas data on exports specifically to the maquiladora sector are not available, the top five manufacturing exports from Arizona to Mexico suggest a strong maquiladora (IMMEX) connection. Arizona’s top manufacturing exports to Mexico are: computer and electronic products; electrical equipment, machinery (excluding electrical); transportation equipment, and primary metal manufacturing.
However, gauging from the dollar value of manufacturing exports coming from other states like Michigan, California, and Illinois that use Arizona’s border ports as gateway to Mexico, there are certainly untapped opportunities for Arizona’s companies to expand trade relationships with the IMMEX sector. For example, out of total $10.3 billion worth manufacturing exports through Nogales port of entry 34.6 percent originated in Michigan, 7.9percent in California, and 3 percent in Illinois. Arizona’s share was 34.6 percent.5
For detailed data and comprehensive analysis of the Arizona-Mexico region and economic relationships, please visit our new Arizona-Mexico Economic Indicators website! Arizona -Mexico Economic Indicators is a product of the Economic and Business Research Center in the Eller College of Management and is sponsored by Arizona-Mexico Commission, Arizona Commerce Authority, Arizona Department of Transportation, and Arizona Office of Tourism.
Notes:
1 De La Cruz, Justino, Robert B. Koopman, Zhi Wang, and Shang-Jin Wei, Estimating Foreign Value-Added in Mexico’s Manufacturing Exports, Office of Economics Working Paper, No.2011-04A, U.S. International Trade Commission, April 2011. www.usitc.gov/publications/332/EC201104A.pdf
2 Average for January-November 2014. Source:INEGI. Estadística Integral del Programa de la Industria Manufacturera, Maquiladora y de Servicios de Exportatción (IMMEX), February 2015, www.inegi.org.mx
3 The third-paced remittances from Mexicans abroad were close to $6 billion, and fourth-placed tourism brought in about $3.7 billion. Data for 2014 Q3. Source: Source:INEGI. Estadística Integral del Programa de la Industria Manufacturera, Maquiladora y de Servicios de Exportatción (IMMEX), February 2015, www.inegi.org.mx
4 Average for January-November 2014. Source: Source:INEGI. Estadística Integral del Programa de la Industria Manufacturera, Maquiladora y de Servicios de Exportatción (IMMEX), February 2015, www.inegi.org.mx
5 Source: U.S. Department of Transportation, Bureau of Transportation Statistics, Transborder Freight Data.
Photo of workers in welding skill up courtesy of Shutterstock.