By Vera Pavlakovich-Kochi, Ph.D.
Senior Regional Scientist and Associate Professor of Geography
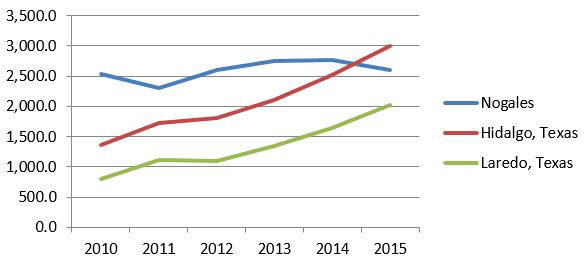
Until last December, when 2015 annual totals for the importation of fresh produce were computed, Arizona’s Nogales port of entry held a century-old position as the major entry point for fresh produce from Mexico to the U.S. According to the U.S. Census, Nogales — for the first time in its long history of importation of Sonora and Sinaloa-grown fresh produce – has lost its leading position among all southern border ports of entry. Measured in dollar value of imported fresh produce, in 2015 Nogales was overtaken by Hidalgo, Texas, and dropped to second place (Figure 1).
Figure 1: Import ($millions) of Mexican fresh produce through top three ports, 2010-2015
Source: AZMEX based on U.S. Census via USA Trade Online
More dramatically, in 2015 Nogales’ share fell to an all-time low of 25.5 percent, surpassing the previous low of 38.8 percent in 2010, and significantly below its long-held high of 60 percent in the 1980s and 1990s. What has happened?
For some time now, concerned voices have been raised by the Nogales fresh produce industry, economic developers, and elected officials who have drawn attention to Texas border ports of entry as they facilitate rapidly increasing volumes of Mexican fresh produce. These voices reflect a widespread perception that Texas border ports are successfully competing with (or against) Nogales. A major reason, as is widely believed, has been that in comparison with Arizona, Texas border ports of entry are better equipped, provide more efficient and time-saving inspection, and thus reduce the cost of border crossings. It has been frequently lamented that delegations from Texas are coming to Nogales and Rio Rico and lure Arizona-based shippers and distributors into their courts by offering new storage facilities and (possibly) other business perks. There is also a real and perceived impact of the newly completed highway Mazatlan-Durango, which after being connected to the existing highway system in Mexico, created the shortest distance from Sinaloa to the U.S. border: about 650 miles to compared to about 720 miles to Nogales.
While each of these facts and perceptions plays a role in Nogales’ declining share of total imports of Mexican fresh produce, is there a reasonable ground for a panic?
Difference between the value and relative share of imported fresh produce
There is a profound difference between various methods applied in how the imports are measured, which of course also depends on the purpose of the particular measurement. The percentage share method is useful to describe a port’s position relative to all other border ports of entry, and if monitored over a time period, shows if the port’s position improved (higher share) or declined (lower share). Accordingly, the achievement of higher shares can be interpreted as a rise in the port’s competitiveness relative to other ports, its declining share is not necessarily a result of declining volumes or values of imports. Alternatively, lower shares simply mean that imports are increasing more rapidly through other ports resulting in a smaller share of an expanded pie.
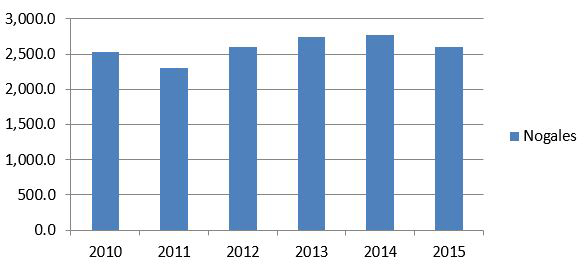
The value of imported fresh produce through Nogales in the last six years varied between $2.5 billion in 2010 and $2.6 billion in 2015 (Figure 2).
Figure 2: Value ($millions) of U.S. imports of fresh produce from Mexico through Nogales, 2010-2015
Source: AZMEX based on U.S. Census via USA Trade Online
The data do not indicate any drastic interruption of the established pattern; rather, the annual variations in dollar value of imported fresh produce might be primarily due to fluctuations in market prices as well resulting from unfavorable weather conditions, such as more or less rain than usual or even frost.
Vegetables vs. fruits
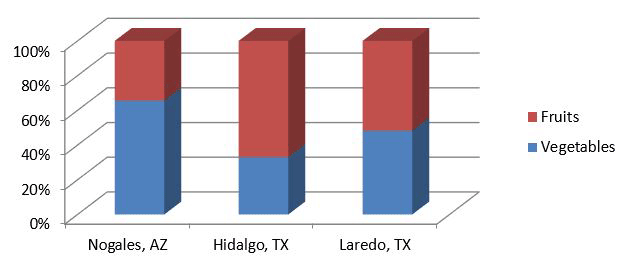
The fresh produce category is comprised of two major commodity groups: vegetables (more specifically, “Edible vegetables & certain roots & tubers”) and fruits and nuts (more specifically, “Edible fruit & nuts; citrus fruit or melon peel”). Disaggregating the data into these two categories uncovers profound differences between the three leading ports of entry (Figure 3).
Figure 3: Composition of Imported Fresh Produce, 2015
Source: AZMEX based on U.S. Census via USA Trade Online
Vegetables comprise about two-thirds of the total value of imported fresh produce through Nogales. In contrast, fruits comprise about two-thirds of the total value of imported fresh produce through Hidalgo. Laredo’s imports are almost equally divided between vegetables and fruits. In both Texas’ ports, Hidalgo and Laredo, the value of imported fruits has increased since 2010. In the case of Nogales, the vegetables-fruits ratio remained unchanged.
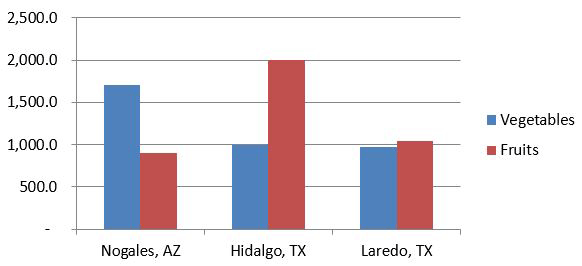
Figure 4 sheds additional light on two important facts. First, Nogales is still the leading port of entry for Mexican-grown vegetables. Second, the increase in imported fresh produce through Texas ports of entry is primarily the result of increased imports of Mexican-grown fruits.
Figure 4: Import of Mexican fresh produce by type and value ($ millions), 2015
Source: AZMEX based on U.S. Census via USA Trade Online
Rate of change
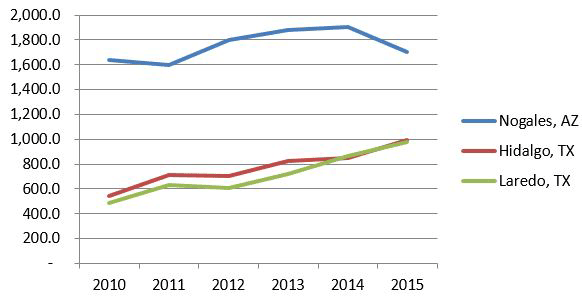
Whereas the next chart (Figure 5) clearly establishes Nogales as the leading port of entry for Mexican-grown vegetables, it also shows that imports of vegetables through Hidalgo and Laredo have increased substantially since 2010.
Figure 5: Import of Mexican vegetables through top three ports, 2010-2015 ($ millions)
Source: AZMEX based on U.S. Census via USA Trade Online
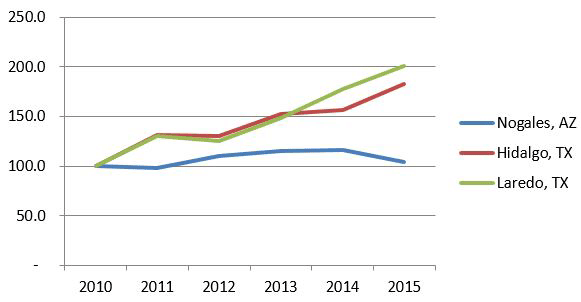
This uneven rate of growth in imported value of vegetables between Nogales and the two Texas’ border ports of entry is even more pronounced when expressed as an index number with 2010 as the baseline (Figure 6).
Figure 6: Growth in import of Mexican vegetables, Index with 2010 =100
Source: AZMEX based on U.S. Census via USA Trade Online
Imports of vegetables through Nogales port of entry, as already noticed, have kept more or less steady during the last six years. In contrast, imports of vegetables doubled through Laredo, following closely with a similar growth rate through Hidalgo.
Conclusions
So far, the data suggest that the changing relative position of the Nogales port of entry in comparison with Texas border ports of entry is not because of shipments being diverted to Hidalgo and Laredo, or at least this does not appear to be the primary reason. Rather, a number of other factors might be at play.
New agricultural areas for exporting fresh produce to the U.S. were more recently developed in central and south Mexico states, such as Nayarit, Jalisco, Michoacán, Guerrero, and México. These regions export primarily through Texas border ports of entry not only because of a mere distance to the border, but also because a lot of these new growers and importers are Texas companies, as well as Canadian. It is said that Texas growers “moved their gardens south of Rio Grande” for a combination of reasons such as lower production costs and growing demand in U.S. and Canada markets.
As for Nogales’ shippers/distributors being lured to Hidalgo or Laredo, the fact is that a number of them have established their offices in Texas. The anecdotal information suggests that at least for some of them this is a strategic move to offset the impacts of pronounced seasonality in the Sinaloa-Sonora fresh produce production and tap into the year-round production in central and south Mexican agricultural regions.
But all of this needs a little bit more data mining outside of official import/export statistics. One thing is sure: importation of fresh produce from Mexico is not as it used to be. Time will only tell whether the newly completed highway Mazatlan-Durango presents a real competition to Nogales border port of entry or simply opens up additional opportunities for Sinaloa growers to reach new U.S. and Canadian markets.
Need to know more?
Visit the Arizona -Mexico Economic Indicators website to find extensive data and analysis on Arizona’s trade & competitiveness in the U.S.-Mexico Region.


