By Vera Pavlakovich-Kochi, Ph.D.
Senior Regional Scientist and Associate Professor of Geography
Who would have guessed in the 1990s, when Nogales, Arizona, firmly held the dominant position among all southern border ports as the main gateway for fresh produce from Mexico, that a scaly, dark green, not particularly attractive, more-like-a-vegetable-looking fruit would experience such a dramatic rise in popularity and become king of Mexico’s fruit exports, and that by 2015 the value of these exports would dethrone Nogales as the southern border’s number one port for fresh produce tilting the ranking scale in favor of Texas? While the total dollar value of Mexican fresh produce imported through Nogales has not actually decreased,1 the fact is that the Nogales port did not gain either from the overall growth of avocado production south of the border, nor benefit from the increasing demand for this healthy fruit north of the border. As is often the case, this shift in the dynamics of fresh produce travelling north may be the consequence of more than a single cause.
Gradual Lifting of Restrictions Under NAFTA
Beginning in the early 1900s, the U.S. prohibited the import of Mexican-grown avocados because of the possibility of introducing harmful pests and diseases into domestic avocado fields, which were then concentrated mainly in California. These restrictions held even after NAFTA was inaugurated in 1994, but began to incrementally break down under the pressure of possible trade retaliation by the Mexican government. First, in 1997, import of avocados grown in the state of Michoacán, in central Mexico, was allowed into thirteen U.S. states. This group did not include California, Florida, or Hawaii, three domestic avocado-producing states. In 2005, restrictions were lifted to allow avocado imports to all of the U.S., but still with the exception of California, Florida, and Hawaii. Finally, in 2007, all restrictions for the import of Mexican avocados were lifted.2
The long lasting restrictions on the import of Mexican avocados to California provided an early advantage for Texas ports, as reflected in data for 2005-2007 (Figure 1). However, even after all restrictions were lifted, it was the Texas ports, most notably Hidalgo and Laredo, that established themselves as the two primary entry points for Mexican avocados.
Figure 1: Imports of Mexican Avocados Through Top Three Ports, 2005-2015 ($ millions)
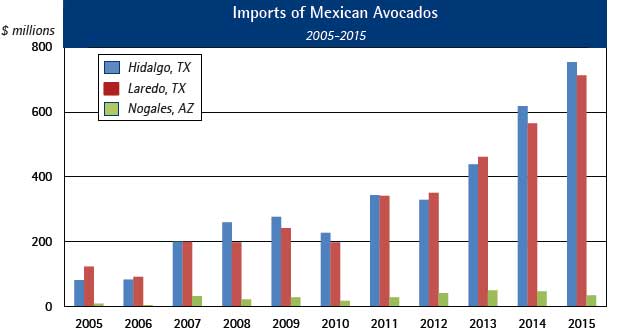
Source: AZMEX, based on U.S. Census via USA Trade Online
In the last five years, from 2011 to 2015, the value of imported avocados entering the U.S. at Hidalgo and Laredo almost tripled at both ports. To casual observers, the rise in avocado imports remained off the radar screen, being buried under aggregated import statistics as “fresh produce.” However, aggregated indicators3 started showing a profound decline in Arizona’s share of Mexican fresh produce imports, this raised concerns about the shifting roles among southern border ports in favor of Texas.
Geography Matters: Avocado-Growing Regions in Mexico
Mexico is the world’s number one avocado growing country, accounting for more than 30 percent of global production.4 The growing fields are heavily concentrated in the state of Michoacán in central Mexico (Figure 2). One of the main reasons for this geographic concentration is the fruit’s “Goldilocks” attitude: the evergreen tree does not like climate that is too wet, too dry, too hot, nor too cold; it does not tolerate cold wind or freezing temperatures.5 Michoacán has the best combination of climate and soil conditions for commercially successful production and currently accounts for more than 85 percent of total Mexican avocado production.6 Avocados are also grown in Morelos, the State of Mèxico, Nayarit, and Jalisco. Currently, only avocados grown in Michoacán are allowed to be imported into the U.S., whereas avocados from other Mexican states are exported worldwide.
Figure 2: Mexico’s Avocado Growing States
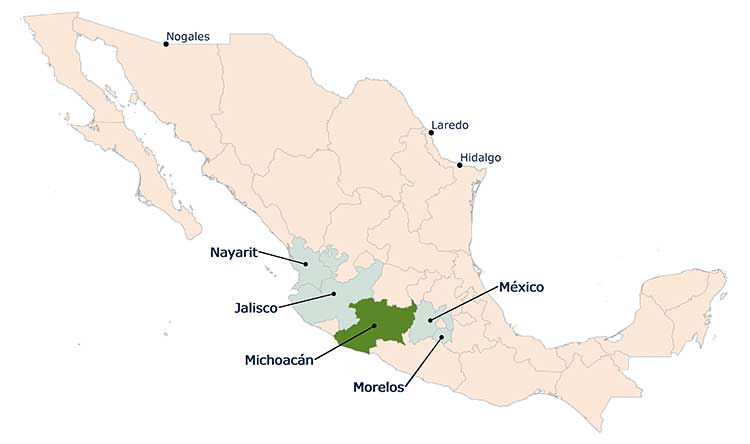
Source: AZMEX, based on U.S. Census via USA Trade Online
Among the more than 20 Michoacán municipalities authorized to export avocados to the U.S., one of the best known is Uruapan. Centrally located within Michoacán, Uruapan is used to calculate average distances to the U.S.-Mexico border (Table 1).
Table 1: Distance from Michoacán to U.S. Border Ports
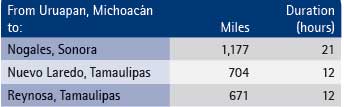
Source: AZMEX based on http://distancecalculator.glbefeed.com for Mexico and U.S.
Clearly, the shortest distances from the major avocado-producing region to the U.S-Mexico border are via Nuevo Laredo in Tamaulipas located across from Laredo in Texas, and Reynosa, also in Tamaulipas located across Hidalgo (McAllen), Texas. In terms of estimated driving time, avocados from Michoacán can reach the Texas border in 12 hours, compared to more than the 21 hours needed to reach Nogales.
Demographics Matters: U.S. Consumption of Mexican Avocados, by State
In a 2014 report, a research team associated with Texas A&M University estimated the value of imported Mexican avocados consumed in the U.S. by state.7 Using avocado consumption data in combination with states’ gross domestic product, the report estimated that California and Texas were two major markets for imported avocados from Mexico, about 14 percent each. The top ten states ranked by value of imported Mexican avocados, after California and Texas, include New York, Washington, Florida, Colorado, Arizona, Illinois, Pennsylvania, and North Carolina (Table 2). As expected, seven of these states – California, Texas, New York, Florida, Colorado, Arizona, and Illinois (marked with an ‘*’ in Table 2) – are also among the top ten states based on the size of the state’s Hispanic population, suggesting an association with the traditional importance of avocados in Mexican and Latino cuisine. The absence of a statistically perfect correlation, however, reflects the growing popularity of avocado in mainstream cuisine due to the increasing awareness of the avocado’s many health benefits and the impact of successful advertising of guacamole during Super Bowl events.
Table 2: Top 10 States Ranked by Value of Imported Mexican Avocados (also shows % Hispanic population by state)
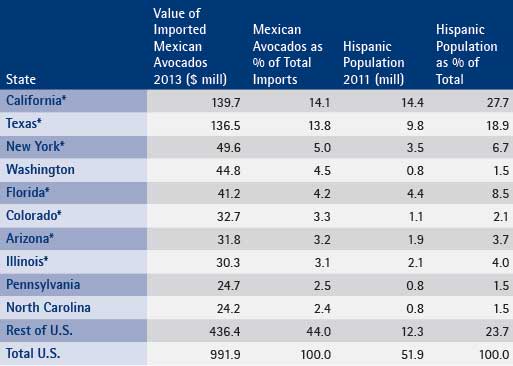
* Among the top ten states ranked by percent of Hispanic population.
Sources: AZMEX based on G.W. Williams, O. Capps, and D. Hanselka, 2014; Pew Research Center based on U.S. Census data
Estimates for California’s consumption of Mexican avocados, valued at about $435 million in 2013, seems rather high given that California is the main domestic producer of avocados in the U.S., However, the authors of the aforementioned report did subtract domestic production from the state’s total avocado consumption.
Assuming that the estimates on consumption of Mexican avocados are reasonable, California’s imports, especially, raise some important questions for Nogales in view of the actual imports volumes through Arizona.
Nogales’ Share of Hypothetical “Trade-Sheds”
For the purpose of this analysis, state-level estimates of Mexican avocado consumption are aggregated into two hypothetical “trade sheds” based on proximity relative to (1) Nogales in Arizona and (2) Texas’ ports of Laredo and Hidalgo. These three ports accounted for 99.8 percent of all imported avocados from Mexico in 2013.
It is reasonable to hypothesize that the port of Nogales is naturally positioned to facilitate imports from Mexico that are destined for the western portion of the U.S., which includes, besides Arizona and California, the following nine states: Colorado, Idaho, Montana, Nevada, New Mexico, Oregon, Utah, Washington, and Wyoming. The rest of the U.S. falls within the hypothesized Laredo-Hidalgo trade-shed that includes the mid-central, north-central, south, south-east, and east-coast regions.
When presented in terms of hypothetical trade-sheds (Figure 3), the data reveal a staggering finding: Nogales’ share of imported Mexican avocados (5.1 percent) appears extremely low compared to the estimated consumption in the Nogales trade-shed of Mexican avocados (33.8 percent). How do Mexican avocados get to California and the west coast region if not through the Nogales port? In 2013, according to U.S. Census data, 94.7 percent of all Mexican avocados were imported through the ports of Laredo and Hidalgo. All other U.S.-Mexico border ports imported less than one percent.8
Figure 3: Imports Through Nogales and Estimated Consumption of Mexican Avocados
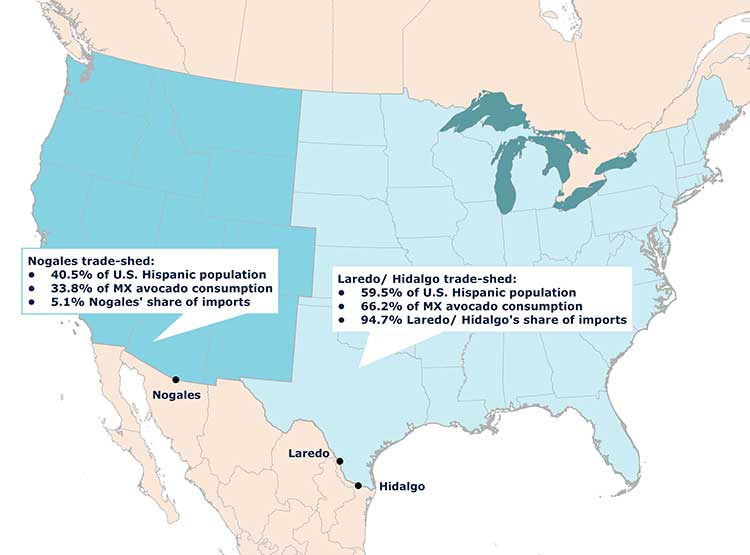
*Excluding Alaska and Hawaii; **Estimates based on G.W. Williams, O. Capps, and D. Hanselka, 2014; *** Based on dollar value of imported Mexican avocados through all southern BPOE, 2013
Distances Revisited: Beyond Geography
If all factors, such as quality of highways, security, check points, wait times at the border, and border inspection procedures are equal, then the shortest distance from Michoacán’s avocado-growing fields to Los Angeles is, no doubt, through Nogales (Table 3). Not counting wait times at the border, it takes on average an estimated 29 hours and a trip of approximately 1,730 miles for avocados to reach Los Angles from Michoacán via Nogales.
Table 3: Distance From Michoacán to Los Angeles Via Selected Border Ports
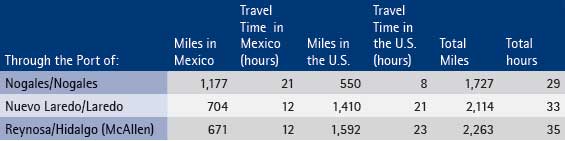
Source: AZMEX based on http://distancecalculator.glbefeed.com for Mexico and U.S.
However, if packers and shippers prefer the shortest possible distances traveled through Mexico, then Laredo and Hidalgo obviously have advantages compared to Nogales. Even with the distance from the U.S. border to Los Angeles almost three times longer than from Nogales, imports through Laredo and Hidalgo may take only 4 to 5 hours more than when shipped through Nogales. This is without taking into consideration wait times before actually reaching the border and the time that it takes for border inspections.
After all, maybe it makes sense for Texas’ economic developers to lure Nogales-based shippers and distributors—who, over the course of a century, developed unique expertise in the trans-border fresh produce business — to their border ports by offering modern warehouses and promising possibly shorter border crossing wait-times.
Acknowledgements
Laurie Sheldon provided detailed Mexican import data and Alan Hoogasian created maps.
[1] See “Nogales, AZ: The main gateway for produce from Mexico, or no more?” By V. Pavlakovich-Kochi, Arizona-Mexico Economic Indicators, March 9, 2016, https://azmex.eller.arizona.edu [2] “Mexico praises lifting of last U.S. avocado import barriers,” The Associated Press, International Herald Tribune, Business Section, February 2, 2007. https:web.archive.org 3/18/2016 [3] See Arizona’s Trade and Competitiveness in the U.S.-Mexico Region, Annual Report 2015, p. 37 http://azmex.eller.arizona.edu [4] The U.S. produces about 7 percent of the world total, followed by Colombia, Brazil, and Peru. Source: Rhoda Richard and Tony Burton, Geo-Mexico: the geography and dynamics of modern Mexico, Sombrero Books: 2010. http://geo-mexico.com/; Dulce Flores, “Mexican avocado exports continue to grow,” GAIN Report No MX4079, USDA Foreign Agricultural Service, November 26, 2014. [5] Arthur C. Gibson, “Plants and civilizations,” Class notes, UCLA. www.botgard.ucla.edu/html/botanytextbooks/economicbotany/index.html 3/18/2016 [6] Dulce Flores, “Mexican avocado exports continue to grow,” GAIN Report No.: MX4079, USDA Foreign Agricultural Service, November 26, 2014. [7] G.W. Williams, O. Capps, and D. Hanselka, “Economic Benefits of the Expansion of Avocado Imports from Mexico: State-by-State Impacts,” Research Report to the Asociación de Productores y Empacadores de Aguacate (APEAM, A.C.) and the Mexican Hass Avocado Import Association (MHAIA), Forecasting and Business Analytics, LLC, College Station, TX, April 2014. [8] AZMEX based on U.S. Census via USA Trade Online https://azmex.eller.arizona.edu
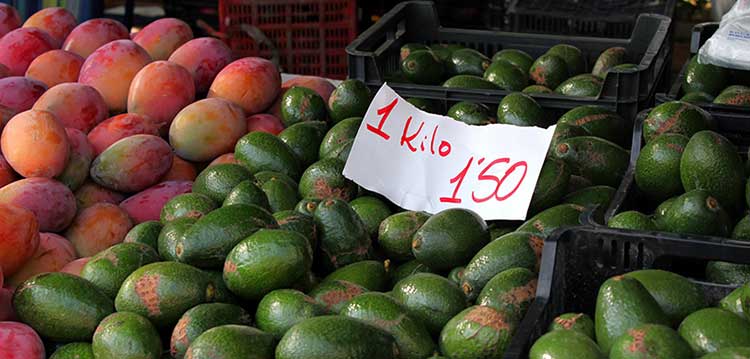
Photo courtesy of pixabay.