
By George W. Hammond, Ph.D.
Director and Research Professor, EBRC
September 12, 2017
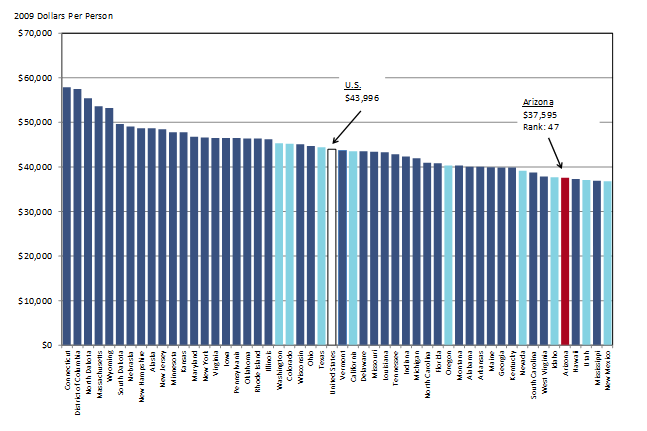
While Arizona is a rapidly growing state, it does not fare so well in terms of monetary measures of its standard of living. As Exhibit 1 shows, the state’s per capita personal income, after adjustment for inflation and the cost of living, ranked 47th in the nation in 2015. That was 14.5% below the U.S. average. It was also well below most western states, with the exceptions of Utah and New Mexico. This analysis uses the Arizona Office of Economic Opportunity population estimate for Arizona, in contrast to the Census population estimate used by the U.S. Bureau of Economic Analysis (BEA), which publishes the data.
Arizona’s per capita income ranked low in large part because wages tend to be low in Arizona. It was also related to the state’s relatively low employment-population ratio (driven by demographics), income from dividends, interest, and rent, and transfer income.
Exhibit 1: Arizona Per Person Income Ranked Low In 2015
U.S. State Per Capita Personal Income, Adjusted for Inflation and the Cost of Living
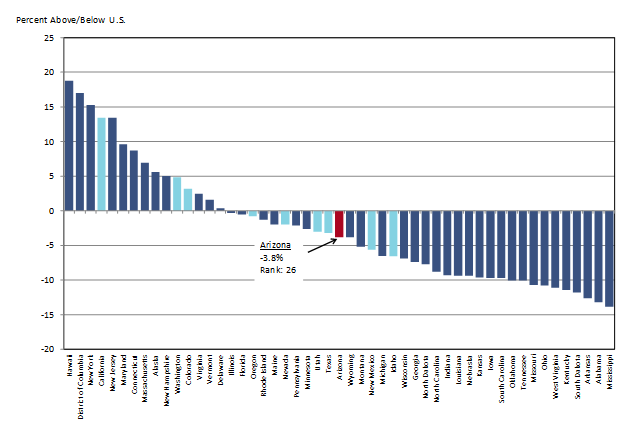
The cost of living, as estimated by the BEA, covers all the main costs faced by households: housing, food, transportation, as well as many other goods and services. The 2015 data are the latest available from the BEA, because there are long data lags in the estimation of housing costs. Exhibit 2 shows that Arizona’s cost of living was roughly in the middle of the pack, ranking 26th in the nation at 3.8% below the national average. The state’s cost of living was well below that of most western states, particularly California. It was slightly above the levels estimated for New Mexico and Idaho, and very close to Texas.
Exhibit 2: Arizona’s Cost of Living Was in the Middle of the Pack
Percentage Difference Between U.S. and State Cost of Living in 2015
While Arizona ranks low on pecuniary measures of the standard of living, it is important to remember that money is just one dimension of a state’s quality of life. Other measures might include climate, crime, pollution, and myriad other factors. The problem for economists boils down to how to combine all of these dimensions into one indicator or ranking. One method that has been proposed in the economic literature is a “voting with your feet” ranking, which exploits domestic migration flows across states. The idea is that the number of people moving to/from a state tells us something important about the overall standard of living available to residents of that state. I use PUMS ACS Five-Year (2011-2015) domestic migration estimates from the Census Bureau.
The method is based on competition: each state is pitted against the other in the competition for migrants. If state A attracts more residents from state B than it loses to state B, then state A wins and we put a +1 in state A’s win/loss column. If state A loses more residents to state B than it attracts, then state A loses and we put a -1 in its win/loss column. Then we sum the wins/losses for state A, which gives us state A’s win/loss record. We do this for all states versus all states and then rank states by their win/loss records.
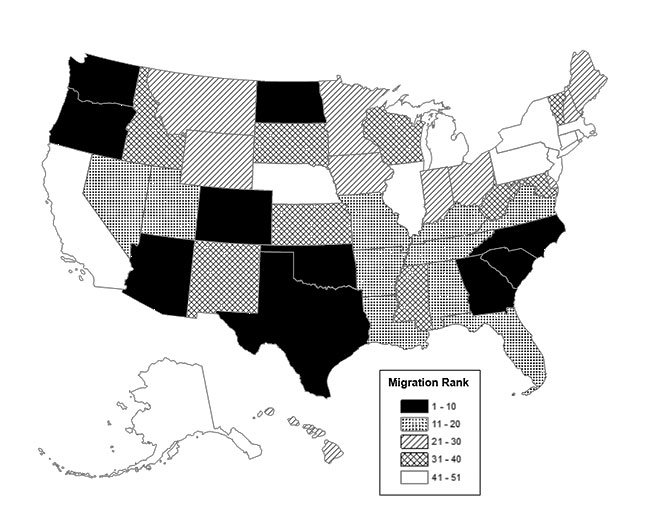
Exhibit 3 shows the results from one such analysis. States that rank high are shaded darker rank higher than states shaded lighter. Note that states in the Southeast, South, and West tended to rank highest. States in the Northeast and Midwest tended to rank lowest. Arizona ranked in the top 10, which is quite a contrast with its per capita income rank. This reflects the fact that Arizona’s climate is a powerful draw and a significant part of its attractive standard of living.
One issue to keep in mind, however, is that the analysis so far reflects the decisions of all migrants, including retirees. If we restrict the analysis to migrants under the age of 65, then Arizona drops out of the top 10 and into the middle quintile. Thus, while Arizona is an attractive migration destination, it is not quite as attractive to those individuals most likely to move to improve their economic prospects.
Exhibit 3: Arizona’s Standard of Living Ranked in the Top 10
Ranking Based on Domestic Migration Data from PUMS ACS 2011-2015
During the past 40 years, Arizona has gradually fallen further and further behind the nation in per capita income, with slow wage growth contributing to the divergence. One key factor driving this has been the trend in Arizona’s four-year college attainment, which has drifted from well above the national average in the 1940s to significantly below average today. If Arizona’s college attainment rate continues to lag behind the national average, it will be very difficult to close the income gap in the future.