
Jennifer Pullen
Research Economist
More than 1/3 of households in Pima County were housing cost burdened in 2013. When households are broken down by tenure (renter vs owner), renters on average are almost twice as likely to be housing cost burdened than owners. Housing cost burden is an important measure of a household’s well-being because cost burdened households, those that spend more than 30% of their income on housing expenditures (including utilities), are more likely to struggle to pay for basic needs such as healthcare, childcare, transportation, and even food.
Pima County and Arizona had a similar percentage of households that were housing cost burdened in 2013 (37.8% and 37.1%, respectively), and both posted slightly higher rates than the U.S. (36.6%). All three regions have seen a significant increase in the percentage of cost burdened households since 2000. The U.S. posted an increase of 9.0 percentage points, while Arizona and Pima County increased by 8.5 and 7.6 percentage points respectively.
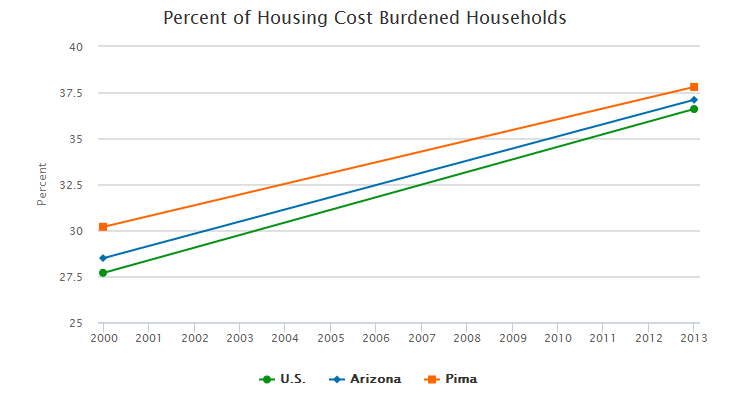
Exhibit 1: Percent of housing cost burdened households in the U.S., Arizona, and Pima County
In 2013, more than half of the renters in Pima County were housing cost burdened, almost double the percentage of homeowners. In Pima County 28.7% of homeowners were cost burdened, similar to the state (29.6%) and the U.S. (28.7%). On the other hand, renters in Pima County had a higher housing cost burden then those in the state and the U.S. with 54.0% paying more than 30% of their income in housing costs. In Pima County, homeowners without a mortgage were significantly less likely to be housing cost burdened (13.4%) when compared to owners with a mortgage (36.6%). Homeowners without a mortgage incur housing costs such as: taxes, insurance, and utilities.
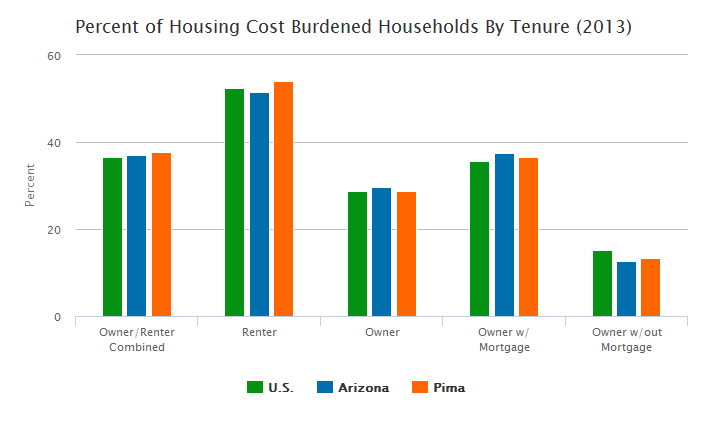
Exhibit 2: Percent of housing cost burdened households by tenure:U.S., Arizona, and Pima County
Cities located throughout Pima County displayed wide variation in the percentage of households that were cost burdened in 2013. Green Valley had the lowest percentage of cost burden households (23.0%), while South Tucson the highest (53.0%). City of Tucson posted a housing cost burden rate of 43.1%, 5.3 percentage points higher than the county.
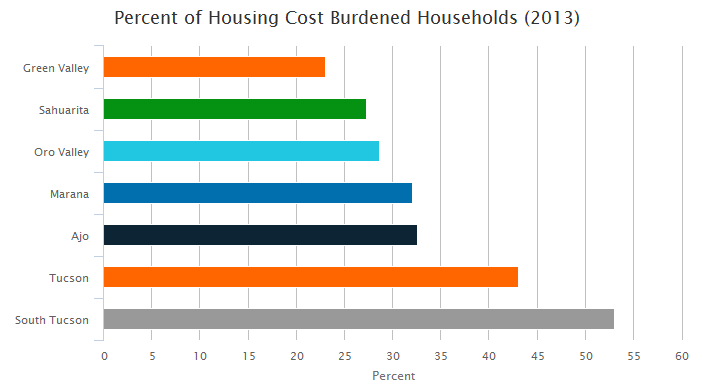
Exhibit 3: Percent of housing cost burdeneded households by Southern Arizona city
During 2013, homeowners located in cities throughout Pima County were significantly less cost burdened than renters. Green Valley had the lowest percentage of homeowners that were cost burdened at 17.5%, while South Tucson and the city of Tucson posted the highest rates at 39.4% and 30.1% respectively. Homeowners can be broken down into those with and without a mortgage. Homeowners without a mortgage tend to be less housing cost burdened than those with a mortgage. Marana posted the largest percentage of cost burdened households without a mortgage at 14.6%, followed closely by the city of Tucson (14.0%) and Ajo (12.7%).
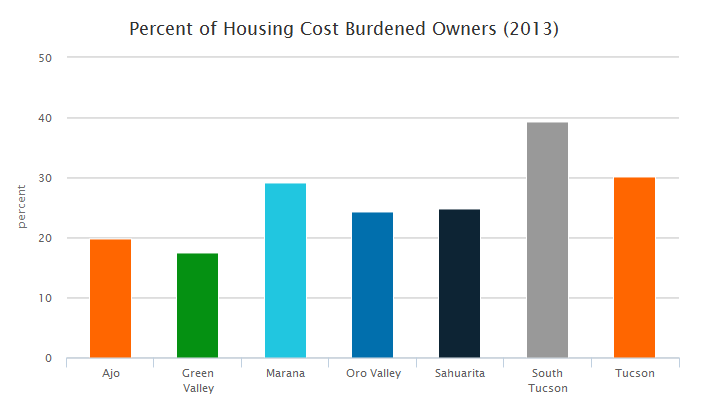
Percent of housing cost burdened home owevers by Southern Arizona city
In Pima County, Sahuarita was the only city with a population greater than 4,000 that posted a housing cost burden for renters below 40.0%. Marana and Oro Valley followed closely behind with 41.4% and 42.6% of their respective renters being designated as cost burdened. In contrast, Ajo had the largest percentage of cost burdened renters of any city (63.0%), not only within Pima County, but of any city in Southern Arizona with a population greater than 4,000. Data for select cities is not presented when the estimates are not sufficiently precise.
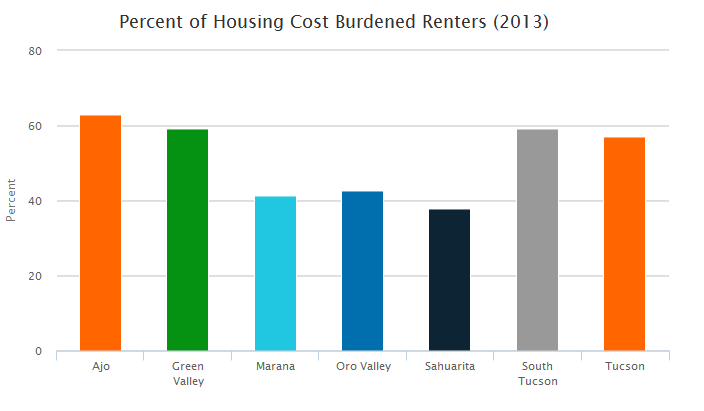
Exhibit 5: Percent of housing cost burdened renter households by Southern Arizona city
Learn more about the housing cost burden for the Arizona counties, metropolitan areas, states, and the U.S. by visiting the Housing Cost Burden indicator page on the Making Action Possible for Southern Arizona (MAP) website. Detailed information on the housing cost burden by trend, tenure, age, and income is available. Additional information about the Housing Cost Burden by tenure for the Southern Arizona cities can be found here. Please note that all estimates provided in this article were obtained from the U.S. Census Bureau, American Community Survey (ACS) five-year estimates in order to directly compare city, county, state, and U.S. data. Data for many of the cities located in Southern Arizona is only available from the ACS five-year estimates. Housing Cost Burden data for Arizona counties, metropolitan areas, states, and the U.S. found elsewhere on the MAP utilizes the ACS three-year estimates, hence you may find slight differences in the values reported.
Photo of old house in Tucson, Arizona, courtesy of Shutterstock.


