by Valorie H. Rice
Senior Specialist, Business Information
Current data releases as of 02 July 2020
The 65 and older population was the fastest growing demographic since 2010, increasing 34.2 percent nationally and 48.4 percent in Arizona. The Census Bureau released 2019 population estimates by demographic characteristics on June 25, providing us with a look at how different breakdowns of population by age, gender, race, and ethnicity have changed since 2010. While the older population increased substantially in Arizona, the under 18 demographic was flat, increasing just 0.7 percent between 2010 and 2019 and actually decreased nationally. The under 18 population in Arizona declined for white and for American Indian, but had better than 20 percent increases for Black, Asian, and two or more races categories. The Asian population had the largest gain in Arizona, growing 44.6 percent compared to a 13.9 percent increase in the total population for the state. Nationally, the Asian population increased 29.3 percent, Exhibit 1.
Exhibit 1.
| Percent Change in Arizona Population Estimates 2010 to 2019 | |
| % Change 2010-2019 | |
| Total Population | 13.9 |
| Under 18 years | 0.7 |
| 65 years and over | 48.4 |
| White | 6.3 |
| Black or African American | 35.2 |
| American Indian and Alaska Native | 11.2 |
| Asian | 44.6 |
| Native Hawaiian and Other Pacific Islander | 24.7 |
| Two or More Races | 39.7 |
| Hispanic | 21.9 |
| Source: U.S. Census Bureau, Population Division | |
Arizona employment in May was down 5.6 percent over-the-year before seasonal adjustment, up from a decrease of 7.5 percent in April based on the June 18 Arizona Office of Economic Opportunity release. Construction and financial activities were the only sectors to gain jobs over-the-year in May and the heaviest job losses were in leisure and hospitality. Year-over-year employment changes for Arizona metropolitan areas were Sierra Vista-Douglas -1.5 percent, Prescott -2.9 percent, Yuma -4.4 percent, Phoenix -5.1 percent, Tucson -5.4 percent, Lake Havasu City-Kingman -10.5 percent, and Flagstaff -17.4 percent. The unadjusted unemployment rate for Arizona was 8.7 percent in May, down from 13.1 in April but nearly twice the rate from May 2019 of 4.6 percent.
May unemployment rates were higher than a year ago in all metropolitan areas tracked by the Bureau of Labor Statistics Metropolitan Area Employment and Unemployment report released July 1. Yuma typically has among the highest unemployment rates in the country. This time, however, Yuma had the least difference in unemployment rate from last year, changing just 0.6 percentage points to 17.8 percent. Kahului-Wailuku-Lahaina, HI, on the other hand, had a change of 30.9 percentage points and the highest unemployment rate of 33.4 percent. Over-the-year change in unemployment for the rest of Arizona metropolitan areas and current unemployment rate are as follows Sierra Vista-Douglas (up 1.7 percentage points) to 7.2 percent, Tucson (up 4.1) to 8.4 percent, Prescott (up 4.2) to 8.5 percent, Phoenix (up 4.3) to 8.3 percent, Flagstaff (up 6.7) to 11.7 percent, Lake Havasu City-Kingman (up 8.3) to 13.8 percent.
Arizona ranked 42 out of all states in the most recent 2020 KIDS COUNT Data Book released June 22. The Annie E. Casey Foundation has been reporting on the condition of the nation’s children since 1990 and the top three states for 2020, Massachusetts, New Hampshire, and Minnesota, have consistently been among the top states for children’s well-being over time. The rankings are a composite of 16 indicators, four each within these four categories: economic well-being, education, health, and family and community. Arizona improved in all economic well-being and education measures and most of the family and community measures compared to 2010, Exhibit 3. The nation showed improvement over time in these categories as well. Arizona rank for economic well-being improved in 2020 to 36 and remained the same for education as well as family and community categories (both at 46). Health measures continue to be a challenge for the state, as conditions compared to 2010 worsened in three out of four measures, as seen in the Arizona profile. (Because of changes to the health category, comparison over time for that category and the overall rank is not advised.)
Exhibit 2.
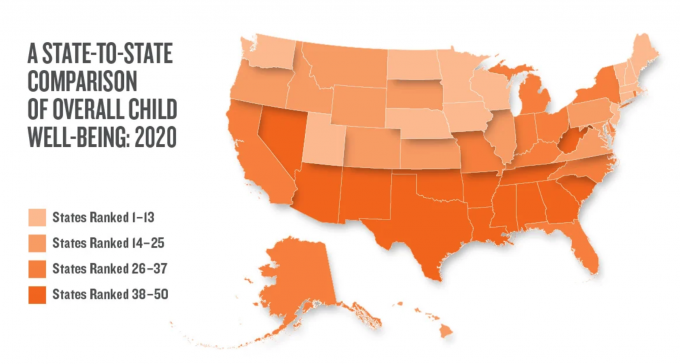
Source: Annie E. Casey Foundation, 2020 KIDS COUNT Data Book, Retrieved from www.aecf.org
Arizona state personal income increased 3.3 percent at an annual rate for the first quarter 2020, a full percentage point higher than the nation at 2.3 percent according to the June 23 Bureau of Economic Analysis release. The change in first quarter 2020 state personal income ranged from a high of 4.9 percent in New Mexico to a decrease of 0.3 percent in Michigan. There was a 10.1 percent increase in transfer receipts for the nation compared to a 3.1 percent increase in the fourth quarter 2019. Transfer receipts increased in every state including Arizona (at 10.4 percent). Net earnings increased 0.3 percent in the nation and 1.1 percent in Arizona.
Exhibit 3. Dollar change in transfer receipts 2019:Q4 to 2020:Q1
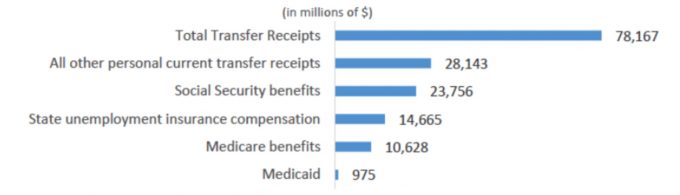
U.S. Bureau of Economic Analysis
Arizona establishments employing 250 to 499 had the highest percentage growth between 2017 and 2018, increasing 11 percent based on new statistics from the Census Bureau 2018 County Business Patterns, released June 25. Smaller establishments (those less than 10 employees) were stable with just 0.6 percent growth. There was a total increase of 1,561 establishments in the state, up 1.1 percent over the previous year. Real estate and rental and leasing establishments was the sector with the largest gain the number of establishments and had the largest percent increase in both employees and payroll.
Real GDP for the U.S. decreased at an annual rate of 5.0 percent in the first quarter 2020 based on the June 25 Bureau of Economic Analysis release. According to the release, the decline reflected a response to “stay-at-home” orders issued in March though the many economic effects of COVID-19 pandemic cannot be measured in full. Real GDP had grown 2.1 percent in the fourth quarter 2019.
Exhibit 4. Real GDP: percent change from preceding quarter, seasonally adjusted annual rates
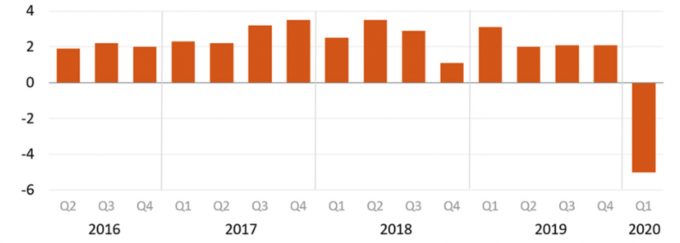
U.S. Bureau of Economic Analysis
Phoenix had the highest home price gains in the S&P CoreLogic Case-Shiller Index for the 11th month in a row with an over-the-year increase of 8.8 percent for April 2020. Home prices nationally were up 4.7 percent over-the-year in April, up slightly from 4.6 percent in March based on the June 30 release. As with the March index, Detroit was not included in April due to records delays for the largest county in the Detroit metropolitan area. The 20-city composite (19 cities this month) had a one-year change of 4.0 percent in home prices.
Total U.S. nonfarm employment continued to tick up on June, adding 4.8 million according to the Employment Situation June 2020 report released from the Bureau of Labor Statistics on July 2. Job figures for previous months are often revised. April employment data were revised down while May data were revised upward with a result of 90,000 more jobs than previously reported for the two months combined. For the month of June, leisure and hospitality had a tremendous increase of 2.1 million. Other industries with considerable job gains were retail trade, education and health services, other services, manufacturing, and professional and business services. The unemployment rate decreased to 11.1 percent and was down across the board for gender, race, ethnicity and education levels listed in the household survey summary table. The employment-to-population ratio continued to increase, moving up to 54.6 in June compared to 51.3 in April and 52.8 in May. It had been 60.7 in June of 2019.
The U.S. trade deficit rose to $54.6 billion in May, up $4.8 billion from the revised April figure. Both exports and imports decreased, however exports dropped much further moving down $6.6 billion to $144.5 billion for May. Imports were $199.1 billion, a decrease of $1.8 billion from the month prior. Year-to-date the deficit of goods and services was down 9.1 percent from the same period in 2019 according to the July 2 joint U.S. Census Bureau and U.S. Bureau of Economic Analysis release.