
By George W. Hammond, EBRC director and Eller research professor
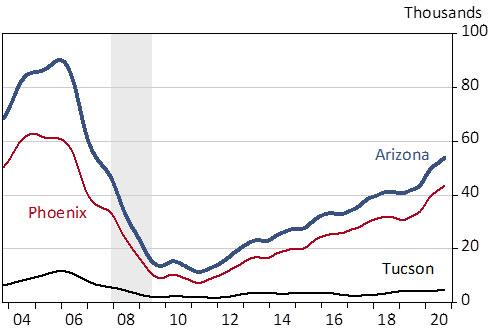
While construction jobs have weakened during the pandemic, housing permit activity has surged (Exhibit 1). Preliminary seasonally adjusted housing permit data suggest that statewide total permits were up 24.7% year to date through September compared to last year. Single-family permits were up 23.7% and multi-family permits were up 27.5%. Strong over-the-year gains in the first quarter of 2020 were followed by slow growth in the second quarter, but activity rebounded strongly in the third quarter.
Total permits in the Phoenix MSA were up 29.9% year to date through September, with single-family activity up 26.4% and multi-family activity up 38.5%.
The Tucson MSA also experienced strong gains year to date through September, with total permits up 17.6%. Single-family permits increased 27.0%, but multi-family activity was down 19.4%.
Exhibit 1: Housing Permits in Arizona, Phoenix, and Tucson, Annualized, Trend-Cycle Component
Weekly Roundup
Arizona initial claims for regular unemployment insurance fell again for the week ended October 24 to 6,813. Claims are running a little less than double the pre-pandemic rate. Initial claims for Pandemic Unemployment Assistance fell significantly during the week to 12,710.
The Arizona Department of Employment Security reports that they have paid out $11.9 billion in benefits from early March through October 24. The Arizona UI Trust Fund balance fell to $163 million.
Note: The official Initial Claims for Unemployment Insurance numbers for the U.S. are released every Thursday morning covering the week ending on the previous Saturday.
National initial claims for regular unemployment insurance fell to 732,223 for the week ended October 24. Initial claims for PUA increased modestly to 359,667.
The travel and tourism sector remains mired at low levels of activity.
The U.S. hotel occupancy rate was 48.0% for the week ended October 24, down 33.7% from year ago.
U.S. movie box office sales fell to $12.2 million for the week ended October 29, down 93.4% from last year. There were 44 new movies released last week, which was 64.5% below the prior year.
U.S. TSA traveler throughput sagged to 5.6 million passengers for the week ended October 31. Passenger screening is roughly one-third of the pace last year.
Seated diners at restaurants using the OpenTable app stabilized during the week ended October 31 in Arizona and Phoenix at 26.1% and 47.1% below last year, respectively.
Travel to retail and recreation places tracked by Google Maps has been modestly trending up for the past couple of weeks, but remains well below activity in January. There has been a similar modest improvement in travel to work.
New business applications in Arizona rose to 570 for the week ended October 24, up 29.5% from a year ago. That pulled the 52-week average up as well, to 8.7% above last year. New business growth may be reflecting job loss associated with the pandemic, as newly unemployed residents seek to replace lost income through new business ventures. While these applications are considered likely to result in new jobs and associated wages, there is no guarantee.
To view the above datasets in graphical and tabular form, we track them in detail continuously on our COVID-19 Indicators page.


