Valorie Rice, Sr. Business Information Specialist
Current data releases as of 19 November 2021
Sierra Vista was one of the most affordable areas in the country for housing in the third quarter 2021 according to the November 11 National Association of Home Builders/Wells Fargo Housing Opportunity Index release. The same could not be said for the rest of Arizona’s metropolitan areas, all of which had much smaller shares of affordable homes and saw a drop in affordability compared to the second quarter of this year. The share of affordable homes in Sierra Vista was 92.9 percent, which placed it among the top five affordable small housing markets in the nation. Prescott was the least affordable metro in Arizona with only 37.3 percent of families earning a median income being able to afford a new or existing home sold in the third quarter. Flagstaff had the largest decrease in affordability between the second and third quarters and had the second lowest share of affordable homes in the state at 39.9 percent. Other Arizona metropolitan areas by share of affordable homes for the quarter were Yuma at 64.9 percent, Tucson at 64.8 percent, Lake Havasu City-Kingman at 54.2 percent, and Phoenix at 51.2 percent. Nationally, 56.6 percent of new and existing houses sold in the third quarter were affordable to families earning the median income of $79,900. This was unchanged from the second quarter, though it is still the lowest affordability level since 2012.
Arizona had 675 bankruptcy filings in October. This was the lowest monthly amount so far this year and 344 fewer than the same month a year ago. Year-to-date bankruptcies in the state were down 27.1 percent from the same period a year ago. The Phoenix office was down 28.7 percent, the Tucson office down 22.9 percent and the Yuma office down 27.3 percent year-to-date. La Paz was the only county to have an increase in filings year-to-date for October and Apache had the largest decrease. The Phoenix office includes Apache, Coconino, Gila, Maricopa, Navajo, and Yavapai counties. The Tucson office handles Cochise, Graham, Greenlee, Pima, Pinal, and Santa Cruz counties, while the Yuma office represents La Paz, Mohave, and Yuma counties.
The Consumer Price Index increased 0.9 percent in October on a seasonally adjusted basis. The change in prices for the month was broad-based. Energy prices were up 4.8 percent as gasoline increased 6.1 percent. The food index increased 0.9 percent with food at home rising 1.0 percent and food away from home increasing 0.8 percent. Used cars and trucks were up 2.5 percent according to the November 10 Bureau of Labor Statistics release. The index for all items less food and energy increased 0.6 percent for the month. The annual inflation rate for October was 6.2 percent, the largest 12-month increase in the index since November 1990.
Use your cursor as a tooltip to switch series ON/OFF at the bottom of the chart. Run your cursor over the chart to view values.
The nation added 531,000 nonfarm payroll jobs in October based on the Bureau of Labor Statistics November 5 Employment Situation release. Leisure and hospitality, professional and business services, manufacturing, and transportation and warehousing all had notable gains though job growth was widespread for the month. Government, specifically public education, was the only sector with decreases in employment. The unemployment rate for the U.S. lowered 0.2 percentage point to 4.6 percent for October. The employment-population ratio was 58.8 percent for the month.
State unemployment rates were stable or lower for the month of October with Arizona having the largest decrease over-the-month (-0.5 percentage point) according to the State Employment and Unemployment November 19 release from the Bureau of Labor Statistics. At 5.2 percent, Arizona was still above the national rate of 4.6 percent. The lowest unemployment rates for September were Nebraska at 1.9 percent and Utah at 2.2 percent. California and Nevada again shared the distinction of having the highest jobless rate for the month at 7.3 percent.
October Arizona nonfarm job growth was 4.8 percent year-over-year before seasonal adjustment according to the November 18 Arizona Office of Economic Opportunity release. For the first in a long time, no sector reported year-over-year job decreases for October though information had no gains or losses. Leisure and hospitality gained the largest amount of jobs over the year. October employment growth in Arizona metropolitan areas, not seasonally adjusted were: Yuma 8.3 percent, Prescott 7.3 percent, Flagstaff 6.7 percent, Phoenix 5.6 percent, Tucson 3.6 percent, Lake Havasu City-Kingman 3.4 percent, and Sierra Vista-Douglas 2.0 percent. At 5.2 percent, Arizona’s seasonally adjusted unemployment rate for October was 0.5 percent points lower than the prior month.
The U.S. trade deficit continued to rise, moving up to $80.9 billion in September from a revised August figure of $72.8 billion according to the joint Census Bureau and Bureau of Economic Analysis November 4 release. Imports increased $1.7 billion over the month $288.5 billion for September. Exports were $207.6 for September, $6.4 billion less than the month prior. The goods deficit was $98.2 billion in September while the services surplus increased to $17.2 billion. Year-to-date the deficit of goods and services was 33.1 percent higher than the same period in 2020.
Most Arizona counties had double-digit personal income growth in 2020 with Yuma increasing the greatest at 18.3 percent. The least amount of growth was in Greenlee County with an increase of 5.8 percent, which was a bit lower than the U.S. growth rate of 6.6 percent. The Bureau of Economic Analysis released county and metropolitan areas personal income data for 2020 on November 16. Nationally, personal income increased more in nonmetropolitan counties (7.6 percent) than in metropolitan counties (6.4 percent). This held true in Arizona as well with metropolitan counties making up five of the six counties with the smallest gains in personal income. Arizona personal income gain for 2020 was 10.3 percent.
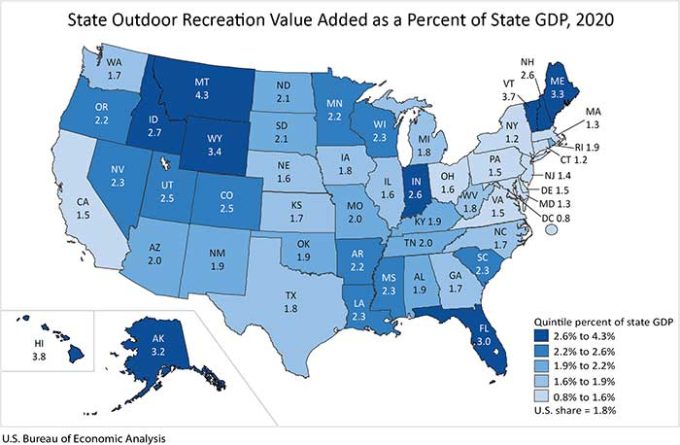
Arizona ranked in the middle of the pack for outdoor recreation economy based on a recent release from the U.S. Bureau of Economic Analysis. Outdoor recreation value added as a percent of state GDP for 2020 was 1.8 percent in the U.S. and ranged from 4.3 percent in Montana to 0.8 percent in the District of Columbia with New York and Connecticut sharing the smallest state amount at 1.2 percent. Arizona was 2.0 percent for 2020. Outdoor recreation employment was lower for all states and the District of Columbia in 2020. Arizona employment decreased 17.4 percent, which was a bit more than the U.S. change of -17.1 percent.