Arizona’s February Jobs Data Raises Red Flags for March Trends
EBRC Research Staff
Current data releases as of 23 April 2025
According to the April 16th State Job Openings and Labor Turnover Survey (JOLTS), the February job openings rate decreased in four states, increased in one state, and was little changed in all other states. Arizona saw a notable decrease in job opening rate over the month (-2.0 percentage points); the job opening rates for Arizona were 4.9% for February, 6.9% for January, and 5.3% for December.
The number of job openings decreased in six states, increased in two states, and were little changed in all other states. The largest decrease in the job opening level was seen in Arizona (-71,000). Hire rates decreased in three states, increased in three states and were little changed in all other states. The hire rates for Arizona were 3.6% for February, 3.5% for January, and 3.9% for December. The number of hires decreased in three states, increased in three states, and changed little in all others. The largest increase in hire levels was in Florida (+135,000). The number of layoffs and discharges decreased in two states, increased in two states, and were little changed in all other states. The largest increase in the layoffs and discharges level occurred in Massachusetts (+44,000). Nationally, the layoffs and discharge rate was little changed over the month. -Alex Jaeger
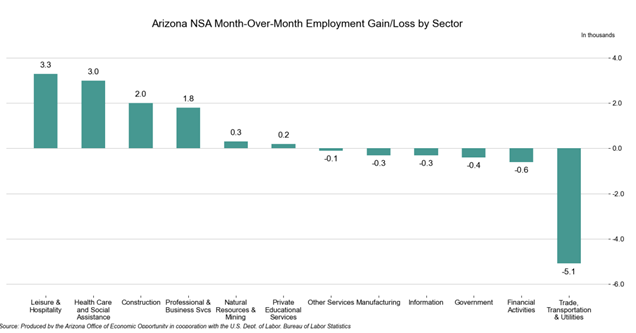
Total nonfarm employment in Arizona decreased by 16,400 jobs over the year in March, with the seasonally-adjusted unemployment rate increasing from 3.9% in February to 4.1%. The U.S. seasonally adjusted unemployment rate increased 0.1 percentage points from 4.1% in February to 4.2%. Arizona non-seasonally adjusted total nonfarm employment increased by 3,800 over the month, worse than the pre-pandemic average of 10,800. Employment gains over the month were reported in Leisure & Hospitality (3,300), Health Care & Social Assistance (3,000), Construction (2,000), Professional & Business Services (1,800), Natural Resources & Mining (300), and Private Educational Services (200). Job losses were reported in Trade, Transportation, & Utilities (-5,100), Financial Activities (-600), Government (-400), Manufacturing (-300), Information (-300), and Other Services (-100). -Delaney O’Kray-Murphy
In March, over the month state unemployment rates were higher in three states, lower in one, and stable in the remaining 46 and the District of Columbia, according to the Bureau of Labor Statistics April 18th release. Arizona’s seasonally adjusted unemployment rate increased by 0.1 percentage points over the month to 4.1%. South Dakota had the lowest unemployment rate in March at 1.8%, while Nevada had the lowest unemployment rate, 5.7%. 28 states and the District of Columbia observed unemployment rate increases over the year, the largest of which were in Michigan (+1.3 percentage points) and Mississippi (+1.1 percentage points). The only over-the-year decrease occurred in Montana (0.3 percentage points). Arizona’s unemployment rate increased 0.8 percentage points from last March. -Delaney O’Kray-Murphy
There were 5,024 building permits filed in Arizona during March, a 6.3% decrease compared to last year. The number of single-family housing units had an even larger decrease over the year at 14.4% with 3,309 permits. Year-to-date, total authorized building permits for the state were down 20.9% for March. There were 3,940 permits filed in Phoenix-Mesa-Chandler MSA during March, a drop of 6.5% compared to the previous year. Single-family permits were also lower, at 2,372 compared to 2,804 in the same month last year. Total permits in Phoenix were down 26.0% year-to-date. Total permits and single-family permits were lower in Tucson as well, with 442 total permits and 380 single-family, with annual decreases of 8.7% and 10.4%, respectively. Year-to-date, the total permitting for Tucson decreased 9.6%. Coconino was one of the counties that reported year-over-year increases in permit activity for March, others being Apache, Graham, Pinal, and Santa Cruz. Building permits were lower over the year in Cochise, Gila, La Paz, Maricopa, Mohave, Navajo, Pima, Yavapai, and Yuma while there was no change in Greenlee. -Valorie Rice
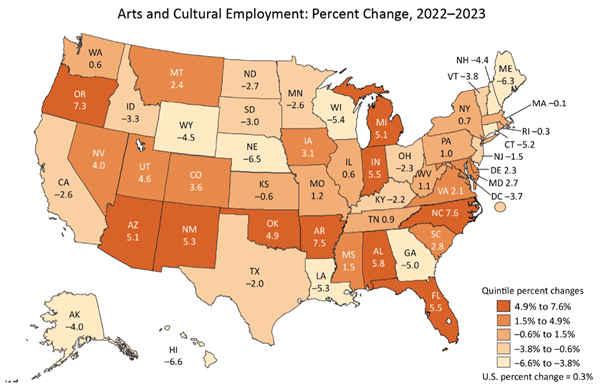
Arts and cultural economic activity increased in the U.S. by an inflation-adjusted 6.6% in 2023, based on a recent report from the U.S. Bureau of Economic Analysis. By comparison, the U.S. gross domestic product (GDP) increased 2.9% in 2023. Of core arts and cultural industries, museums lead with an increase of 18.0% in 2023, followed by design services at 6.3%, performing arts at 3.5%, and education services at 1.8%. Supporting arts and cultural production industries increased by 7.1% in 2023. Nominally, value added in arts and cultural sectors increased 7.6% in 2023 in the U.S. and ranged from -3.4% in Louisiana to 14.7% in Nevada. The arts and cultural share of total GDP ranged between 2% and 5% for most states, including Arizona (which was 3.0%). Only a handful of states experienced a larger share, with Washington having the largest at 9.8%. Arts and cultural employment increased 0.3% nationally between 2022 and 2023 and Arizona was among the states with the largest increase in arts and cultural employment at 5.1%. North Carolina had the most substantial increase in employment at 7.6% while Hawaii decreased by 6.6%. – Valorie Rice