Phoenix Maintains Top 5 Status as Arizona Cities Lead in Growth
EBRC Research Staff
Current data releases as of 16 May 2025
Phoenix remained the fifth-largest city in the U.S. in 2024, based on U.S. Census Bureau city and town population estimates released May 15. Phoenix city was also among the top 10 cities for the largest increase in the number of people added between July 1, 2023, and July 1, 2024, given its size, which calculated into a 1.0% increase. The fastest-growing cities and towns over the size of 20,000 in 2024 were primarily in Texas, which held four of the top five spots. The population of Princeton city, Texas, increased a whopping 30.6% over the year, followed by Fulshear city, Texas, at 26.9%, Leesburg city, Florida, at 18.5%, and Celina city, Texas at, 18.2%. The fastest-growing city with a population of 20,000 or more in Arizona for 2024, based on Census Bureau population estimates, was Queen Creek at an increase of 8.1%, ranking it 23rd out of all cities and towns. The fastest growing city in Arizona with fewer than 20,000 residents was Tolleson, which posted a 29.8% increase over the year. This release also included estimates of housing unit change for states and counties. The change in housing units for Arizona was 1.7%, ranking it fifth among states. Idaho had the largest increase in housing units at a 2.2% change, followed by Utah at 2.0% and North Carolina at 1.9%. Maricopa County, Arizona, had the largest numeric change in housing units between 2023 and 2024, adding 38,000. Maricopa and Pinal counties had a 2% or better increase in housing units over the year (2.0% and 2.2%, respectively). All other Arizona counties experienced gains in housing, though less than 2%. -Valorie Rice
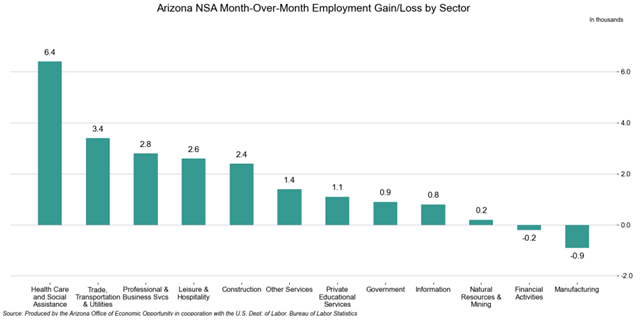
Total nonfarm employment in Arizona increased by 18,100 jobs over the year in April, with the seasonally adjusted unemployment rate remaining at 4.1%. The U.S. seasonally adjusted unemployment rate also remained the same over the month at 4.2%. Arizona non-seasonally adjusted total nonfarm employment increased by 20,900 jobs in April, beating the pre-pandemic average of 9,500. Employment gains were reported in Health Care & Social Assistance (6,400), Trade, Transportation, & Utilities (3,400), Professional & Business Services (2,800), Leisure & Hospitality (2,600), Construction (2,400), Other Services (1,400), Private Educational Services (1,100), Government (900), Information (800), and Natural Resources & Mining (200). Job losses were recorded in Manufacturing (-900) and Financial Activities (-200). -Delaney O’Kray-Murphy

The U.S. consumer price index for all items rose 0.2% over the month in April. That was up from a 0.1% decline in March. Over the year, the all-items index increased 2.3%, slightly slower than the 2.4% increase in March and the slowest increase since February 2021. All-items less food and energy inflation was 2.8% over the year. Food at home prices fell over the month but were still up 2.0% over the year. Egg prices fell last month but remained up 49.3% over the year. Energy prices were down over the year, driven by gasoline.
The Phoenix MSA all-items consumer price index rose 0.3% over the year in April, which was the slowest increase of any of the metropolitan areas reporting data for the month. New York-Newark-Jersey City reported the fastest increase at 3.9%. In Phoenix, all items less food and energy inflation dropped to 0.7% in April. Consumer commodities prices fell 1.4%, while services rose 1.1%. Shelter inflation, which includes rent, owner-equivalent rent, and short-term rentals, fell from 1.2% in February to -0.1% in April. -George Hammond
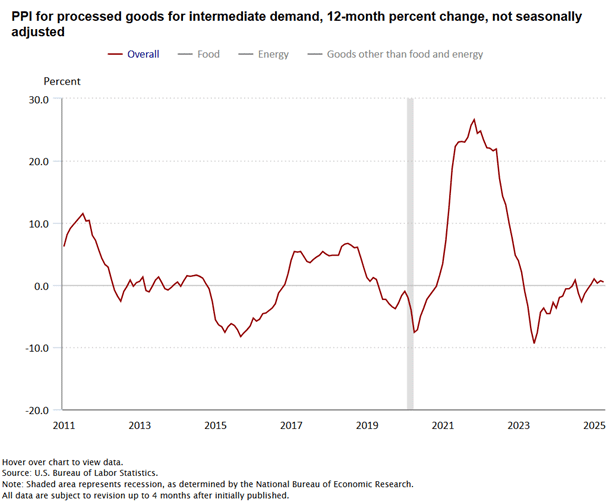
The U.S. producer price index for final demand fell 0.5% over the month in April, down from no change in March. The April decline was driven by services, with goods prices unchanged, reflecting depressed margins in wholesale and retail trade. Over the year, the final demand index was up 2.4%. Prices for processed goods for intermediate demand rose 0.5% over the year in April, while prices for unprocessed goods for intermediate demand were up 1.7%. -George Hammond

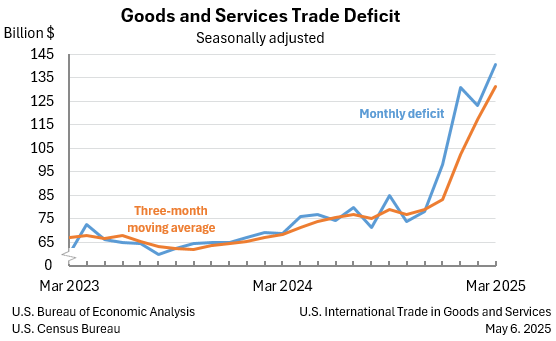
The March goods and services trade deficit came in at $140.5 billion, up $17.3 billion from a revised $123.2 billion in February. March exports rose $0.5 billion to $278.5 billion, and imports rose $17.8 billion to $419.0 billion. The increase in the deficit reflects an increase in the goods deficit of $16.5 billion to $163.5 billion and a decrease in the services surplus of $0.8 billion to $23.0 billion. Over the year, the goods and services deficit increased 92.6% or $189.6 billion, with exports rising 5.2% and imports increasing 23.3%. The largest surpluses, in billion, occurred with Netherlands ($4.5), South and Central America ($3.2), and Hong Kong ($1.9), while the greatest deficits were with European Union ($48.3), Ireland ($29.3), and China ($24.8). -Delaney O’Kray-Murphy

U.S. per-pupil school system spending was $16,526 in 2023, up 5.7% from 2022. The West region was home to three of the four states spending the least amount per pupil on pre-K through 12th-grade school systems. This included Arizona, which had the fourth-lowest amount in 2023 at $11,297. Idaho was the lowest at $10,247, followed by Utah at $10,333, Oklahoma at $11,155, and Arizona. School spending was highest in the Northeast. New York ($30,012) had historically been the state with the highest per-pupil spending, though, in 2023, the District of Columbia spent the largest amount at $31,629. -Valorie Rice


