U.S. GDP Contracts for First Time in Over Two Years
EBRC Research Staff
Current data releases as of 2 May 2025
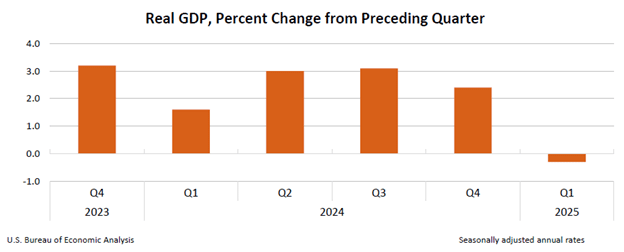
U.S. real gross domestic product (GDP) decreased at an annual rate of 0.3% in the first quarter of 2025, according to the advanced estimate released by the Bureau of Economic Analysis. The decrease in real GDP primarily reflects an increase in imports, a subtraction of GDP, and a decrease in government spending. These decreases were partly offset by increases in investment, consumer spending, and exports. Current-dollar GDP increased at an annual rate of 3.5%. The price index for gross domestic purchases increased by 3.4%, and the personal consumption expenditure (PCE) price index rose by 3.6% from the fourth quarter of 2024 to the first quarter of 2025. -Delaney O’Kray-Murphy

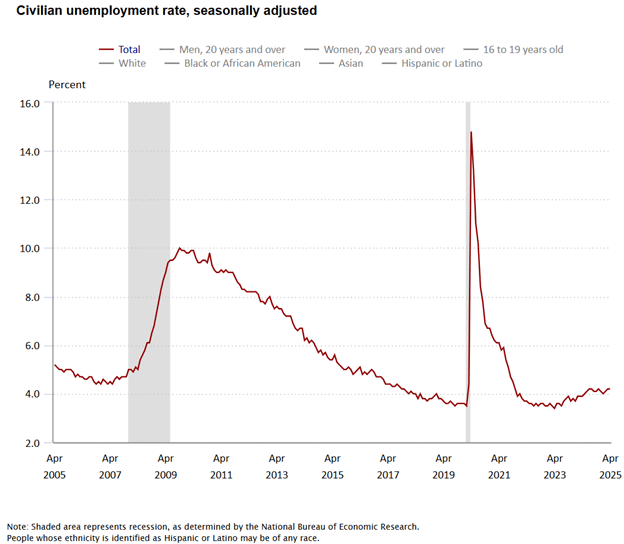
The U.S. economy added 177,000 jobs over the month in April. The seasonally-adjusted unemployment rate was unchanged over the month at 4.2% but up from 3.4% two years ago. Job gains in April were concentrated in private education and health care; transportation and warehousing; leisure and hospitality; professional and business services; financial activities; and construction. Federal government jobs declined over the month and are down 26,000 since January. Estimates for February and March were revised down. Over the year in April, U.S. jobs were up 1.2%, slightly faster than the revised 1.1% increase in March. – George Hammond

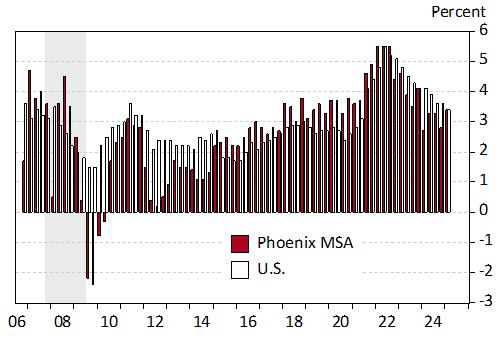
U.S. compensation costs for civilian workers, measured by the Employment Cost Index from the U.S. Bureau of Labor Statistics (BLS), rose 0.9% over the quarter in March 2025. These data measure the change in the hourly cost of labor, after adjusting for employment shifts across industries and occupations. Civilian compensation costs were up 3.6% over the year. Wages were up 3.5% and benefits were up 3.8%. Private-sector compensation was up 3.4% over the year in March 2025, slower than growth last year at 4.1%. For the Phoenix MSA, private-sector compensation increased 3.4% over the year in March, which was faster than last year (2.7%). – George Hammond
Private-Sector Employment Cost Growth for the Phoenix MSA and the U.S., Over the Year, Percent

The March 2025 release of the Job Openings and Labor Turnover (JOLTS) report stated that the number of job openings in the U.S. changed little at 7.2 million, with a job openings rate of 4.3%. The number of job openings decreased in federal government (-36,000). Nationally, the number of hires was unchanged at 5.4 million. The February hirings rate came in at 3.4%, the fourth consecutive month at this level. The number of total separations in the nation changed little at 5.1 million, with a rate of 3.2%. The number of quits was unchanged at 3.3 million with a rate of 2.1%. The number of layoffs and discharges changed little at 1.6 million and a rate of 1.0%. Layoffs and discharges decreased in retail trade (-67,000) and in federal government (-11,000). There was an increase in layoffs and discharges in state and local government, excluding education (+17,000). -Alex Jaeger
In March, metropolitan unemployment rates were higher in 279 of the 387 metropolitan areas, lower in 72, and unchanged in the following 36, according to the U.S. Bureau of Labor Statistics April 29th release. The March unemployment rate for the Tucson and Phoenix metropolitan areas came in at 4.1% and 3.6%, respectively. Yuma had the highest unemployment rate in Arizona at 11.2%, and Phoenix had the lowest. Rapid City, SD, and Sioux Falls, SD-MN, had the lowest unemployment rates at 1.7% and 1.8%, respectively, while El Centro, CA, had the highest rate at 16.4%. The largest over-the-year unemployment rate occurred in Yuma, AZ (+2.6 percentage points), and Kahului-Wailuku, HI, had the largest decrease (-1.7 percentage points). -Delaney O’Kray-Murphy
Phoenix house prices increased 2.3% over the year in February based on the S&P CoreLogic Case-Shiller Index. Nationally, house prices had an annual gain of 3.9% for the same period, while the 20-city composite gained 4.5%. The U.S. and the 20-city composite had lower price gains in February compared to the month before, as did Phoenix. New York continued to be the metropolitan area with the largest house price gain, with a February increase of 7.7% over the year, followed by Chicago at 7.0%; Chicago has been in second place for several months. Tampa was the only metropolitan area on the 20-city list with negative price changes in February, posting a decrease of 1.5%. Miami and Tampa were the only areas with month-over-month declines in house prices between January and February. -Valorie Rice


