
Strong GDP Gains While Phoenix Housing Market Cools
By EBRC Research Staff
Current Data as of 30 January 2026
Real gross domestic product (GDP) increased at an annual rate of 4.4% in the third quarter of 2025, according to the updated estimate released by the Bureau of Economic Analysis. In the second quarter, real GDP rose 3.8%. Real GDP in the third quarter was revised up by 0.1 percentage points from the initial estimate, primarily reflecting upwards revisions to exports and investment that were partially offset by a downward revision to consumer spending. Real gross domestic income, an alternate measure of GDP, increased 2.4% in the third quarter. The price index for gross domestic purchases increased 3.4% in the third quarter, and the personal consumption expenditures (PCE) price index increased 2.8%. -Delaney O’Kray-Murphy
Real GDP for the third quarter of 2025 rose in all 50 states and the District of Columbia. Arizona GDP increased 4.6%, just above the national increase of 4.4%. State real GDP in the third quarter of 2025 ranged from 0.4% in North Dakota to 6.5% in Kansas. Leading contributors to growth nationally and for nearly half of all states were information; finance and insurance; and professional, scientific, and technical services. The agriculture, forestry, fishing, and hunting sector was the leading contributor to growth for Kansas and South Dakota, which had the second-largest increase in GDP among states. Personal income rose at an annual rate of 3.3% in the U.S. in the third quarter of 2025, with state income increases ranging from 0.1% in Louisiana to 6.3% in Kansas. Personal income in Arizona rose 3.2% during that period. -Valorie Rice

Phoenix house prices declined 1.4% over the year in November based on the latest S&P Cotality Case-Shiller report, in contrast to the 1.4% gain in house prices nationally. The 20-city composite also reported an increase of 1.4% over the year in November. The highest annual gain in prices was reported in Chicago at 5.7%, followed by New York at 5.0% and Cleveland at 3.4%. Tampa continued to experience decreasing house prices, falling 3.9% over the year in November. This was the 13th month of declining house prices for Tampa. Eight other metro areas also reported year-over-year declines in house prices: Dallas, Phoenix, Denver, Miami, Portland, Las Vegas, Seattle, and Atlanta. -Valorie
Total nonfarm employment in Arizona increased by 24,600 jobs year-over-year in December, with the seasonally adjusted unemployment rate remaining at 4.3%. The U.S. seasonally adjusted unemployment rate fell 0.1 percentage points to 4.4% in December. Arizona non-seasonally adjusted nonfarm employment increased 6,500 jobs in November, more than the pre-pandemic average of 5,600. Employment gains were reported in Trade, Transportation, & Utilities (5,900), Health Care and Social Assistance (2,900), Leisure & Hospitality (2,600), Financial Activities (2,000), Construction (1,200), Other Services (400), Professional & Business Services (300), Information (300), and Natural Resources & Mining (200). Employment losses were reported in Government (-7,000), Manufacturing (-1,400), and Private Educational Services (-900). -Delaney O’Kray-Murphy

In December, over the month state unemployment rates were higher in 6 states and stable in the remaining 44 and the District of Columbia. Arizona’s seasonally adjusted unemployment rate remained unchanged over the month at 4.3%. Hawaii and South Dakota had the lowest jobless rates in December at 2.2%. The District of Columbia had the highest unemployment rate at 6.7%, followed by California and New Jersey at 5.5% and 5.4%, respectively. Twenty-one states and the District of Columbia saw unemployment rate increases over the year, the largest of which was in Delaware (+1.6 percentage points). Eight states had over-the-year rate decreases, the largest of which was in Indiana (-0.9 percentage points). -Delaney O’Kray-Murphy
Labor turnover changed little in Arizona over the month in November, according to the U.S. Bureau of Labor Statistics State Job Openings and Labor Turnover Survey (JOLTS). Job openings rates decreased in seven states and changed little in all other states. Alaska (-3.9 percentage points), Wyoming (-2.7 points), and Montana (-2.0 points) reported the largest decreases in the job openings rate. The seasonally adjusted job openings rate in Arizona for November was 4.2%, down from 4.5% in October and 5.3% in September. The hires rate increased in one state, Rhode Island (1.0 percentage point), decreased in four states (including Alaska at -3.8 points and Wyoming at -1.4 points), and was little changed in all other states, including Arizona. The total separations rates were statistically higher in six states and declined in two states. Increases were noted in Idaho (1.5 percentage points), Alaska (1.4 points), and Tennessee (1.1 points), while the two states with decreases were Michigan (-1.1 points) and Indiana (-0.7 points). The Arizona total separations rate was unchanged at 3.4%. Within separations, the quits rate increased in six states and decreased in one (New York). Seven states had lower layoff and discharges rates, while they increased in one (Idaho). Note that the December report for state JOLTS coming next month will be the final monthly release as the report will transition to an annual news release. The first annual release will occur in July 2026. -Valorie Rice
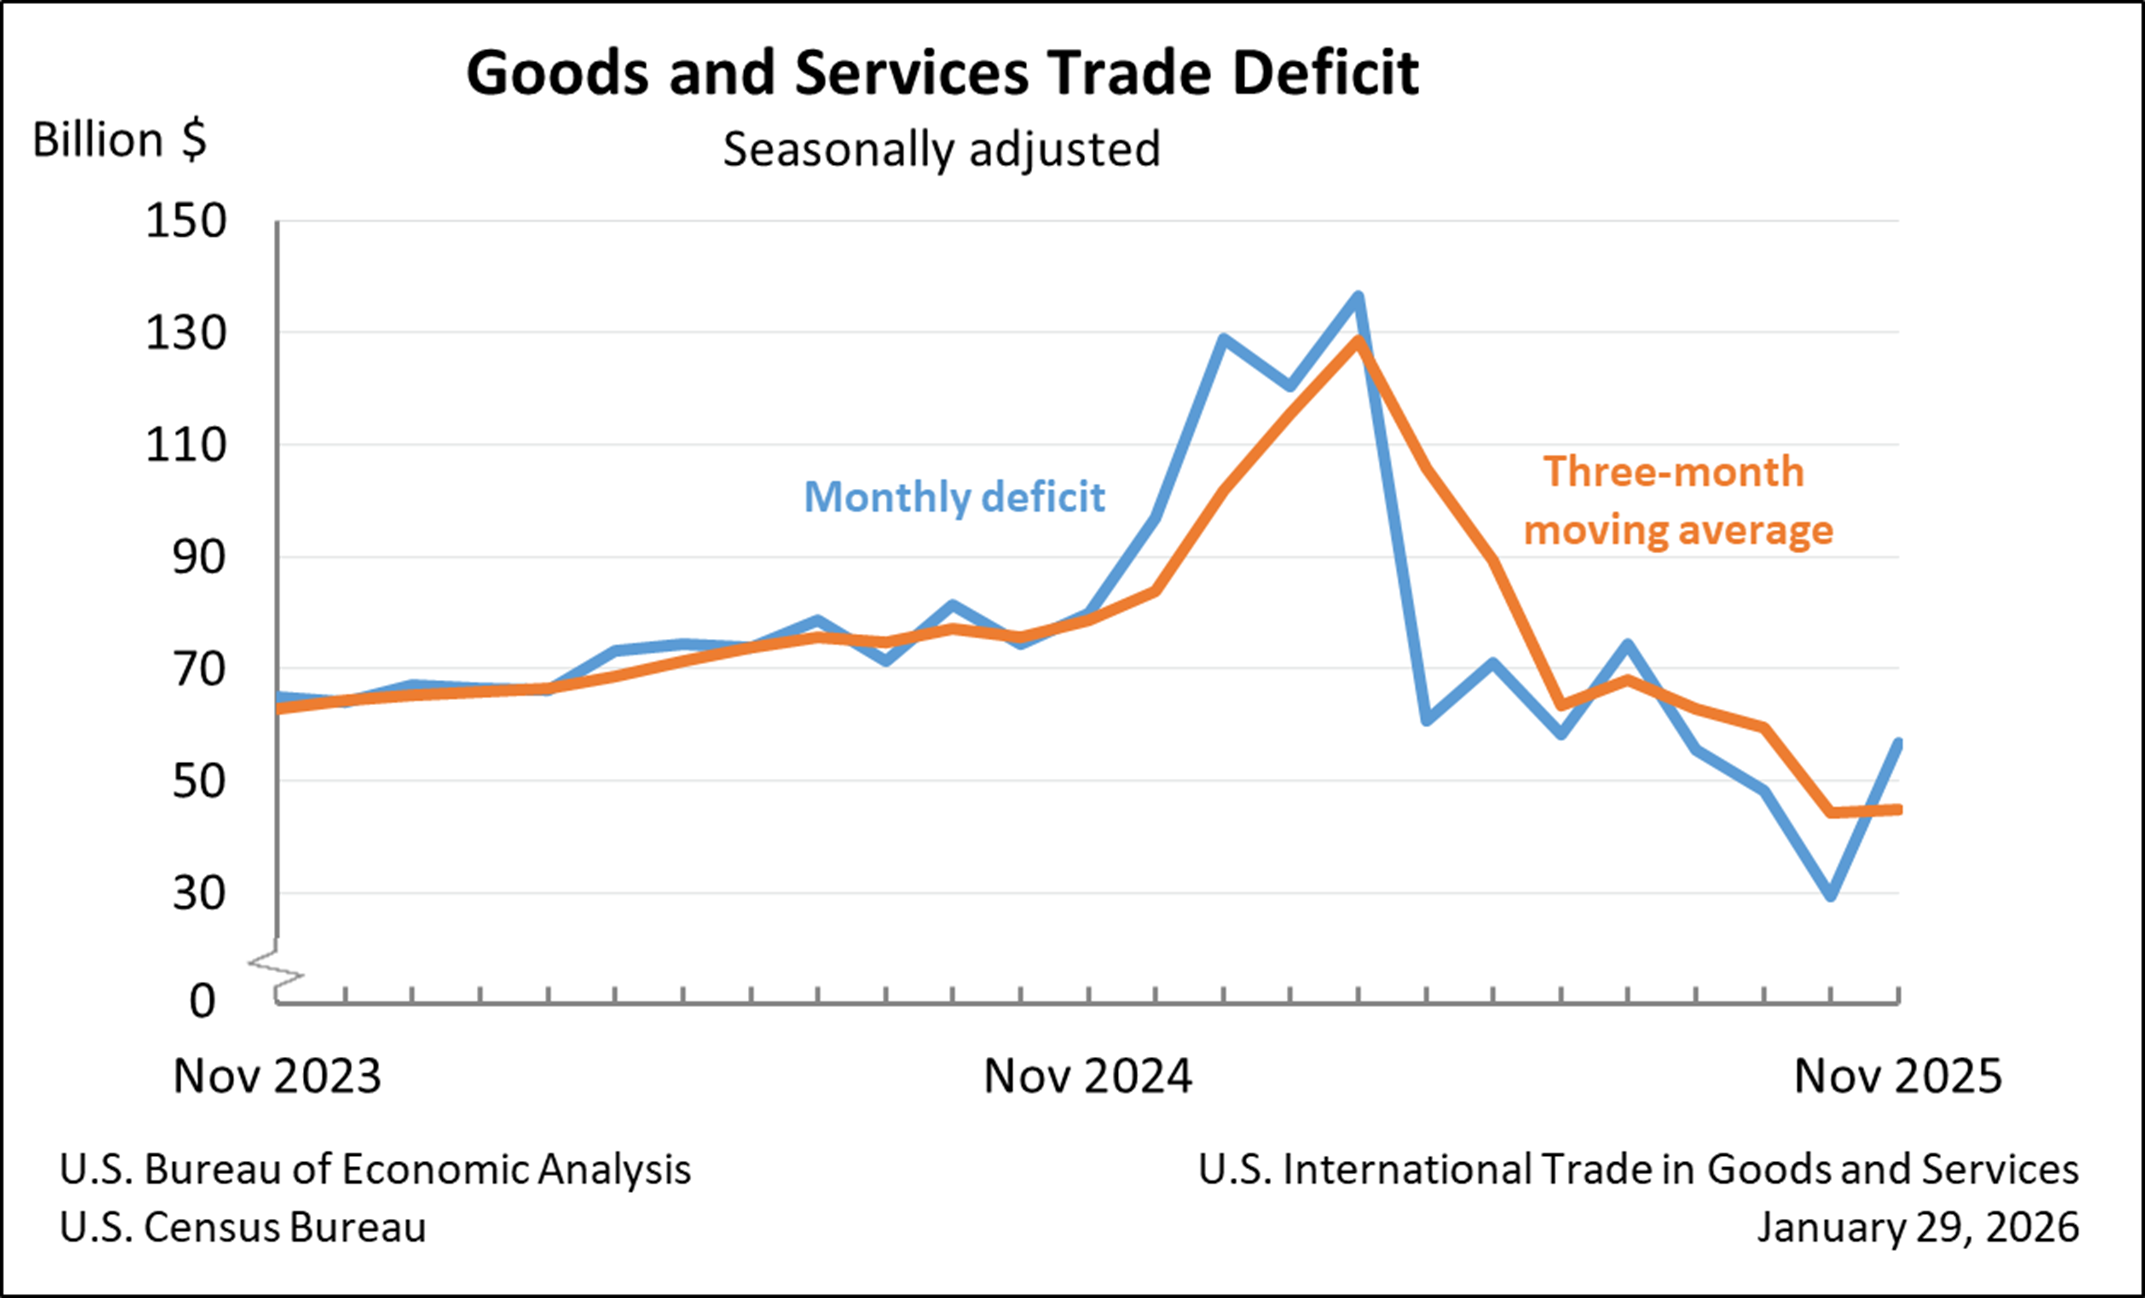
The November goods and services trade deficit came in at $56.8 billion, up $27.6 billion from a revised $29.2 billion in October. November exports fell $10.9 billion to $292.1 billion, and November imports rose $16.8 billion to $348.9 billion. The increase in the deficit reflects an increase in the goods deficit of $27.9 billion to $86.9 billion and an increase in the service surplus of $0.3 billion to $30.1 billion. Year-to-date, the goods and services deficit increased $32.9 billion, or 4.1%, from the same period last year, with exports rising 6.3% and imports rising 5.8%. The largest surpluses, in billions, were with Switzerland ($7.8), Netherlands ($5.6), and South and Central America ($5.1), while the greatest deficits were with Mexico ($17.8), Vietnam ($16.2), and Taiwan ($15.6). -Delaney O’Kray-Murphy
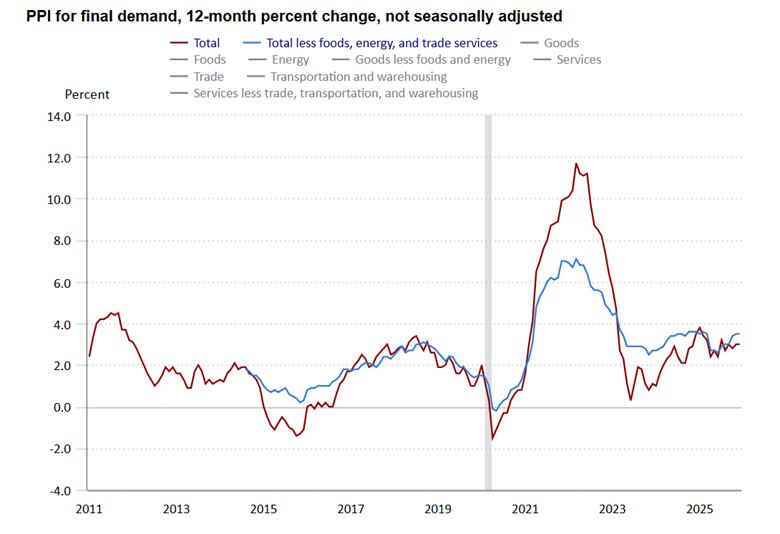
The Producer Price Index for final demand rose 0.5% over the month in December, after increases of 0.2% and 0.1% in November and October, respectively. Over the year, the final demand index rose 3.0%, the same as the November increase. On an annual average basis, the final demand index rose 3.0% in 2025, after a 2.4% increase in the prior year. Final demand services drove the December over-the-month increase. Prices for processed goods for intermediate demand rose 3.4% over the year in December. Conversely, prices for unprocessed goods for intermediate demand fell 0.3% over the year. -George Hammond
There have been considerable gains in educational attainment for the nation’s metropolitan areas based on the 2024 American Community Survey (ACS) 5-year estimates that were released January 29. The U.S. Census Bureau release indicated that nearly 89% of metropolitan areas experienced an increase in the percentage of adults age 25 and over with a bachelor’s degree between 2015-2019 and 2020-2024, the periods covering the latest comparable ACS 5-year estimates. All seven of Arizona’s metropolitan areas registered an increase in educational attainment, ranging from 1.8 percentage points in Yuma to 5.0 percentage points in Sierra Vista. Flagstaff had the highest educational attainment for 2020-2024 at 40.3%, followed by Tucson at 36.8% and Phoenix at 35.3%. As educational attainment increased over the five years, the poverty rate decreased. Nationally, the poverty rate during the 2020-2024 period was 12.5%, down from 13.4% during the 2015-2019 period. The most dramatic drop for Arizona metropolitan areas was in Yuma, which declined from 19.4% during the 2015-2019 period to 15.6 % for the 2020-2024 period. The Phoenix metro area had the lowest poverty rate for 2020-2024 at 11.0%, while Flagstaff had the highest at 16.8%. -Valorie Rice
The U.S. population grew by 0.5% between July 1, 2024, and July 1, 2025, based on the U.S. Census Bureau population estimates for 2025 released on January 27. This was the slowest growth since 2021, largely due to a decline in net international migration. Every state except for Montana and West Virginia experienced slower growth or an increased decline in population compared to 2024. The Arizona population increased 0.9% in 2025, down from 1.4% growth in 2024, yet it still placed among the top 10 growth states, in 8th position. South Carolina was the fastest-growing state in 2025, with a 1.5% increase, followed by Idaho at 1.4%, North Carolina at 1.3%, and Texas at 1.2%. There were five states with declining populations over the year: California, Hawaii, New Mexico, Vermont, and West Virginia. -Valorie Rice