
Arizona Outpaces the Nation on Income and Hiring Even as U.S. Job Growth Stumbles
By: EBRC Research Staff
Current Data as of 6 March 2026
Total U.S. nonfarm payroll employment slid 92,000 in February, and the unemployment rate changed little at 4.4%, based on the Bureau of Labor Statistics employment situation release. Employment decreased in health care (-28,000), information (-11,000), federal government (-10,000), and transportation and warehousing (-11,000). Employment trended up in social assistance (9,000) and showed little or no change in other major industries. The change in total nonfarm employment for December was revised down by 65,000 to -17,000, and the change for January was revised down by 4,000 to 126,000. In February, average hourly earnings for employees on private nonfarm payrolls rose 15 cents, or 0.4%, to $37.32. The average workweek for private nonfarm payrolls was unchanged at 34.3 hours. -Delaney O’Kray-Murphy
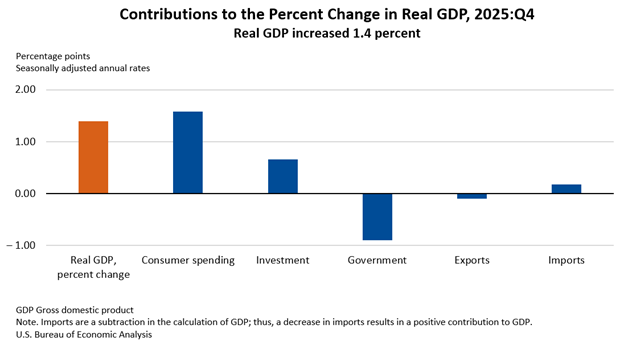
Real gross domestic product (GDP) increased at an annual rate of 1.4% in the fourth quarter of 2025, according to the advanced estimate released by the Bureau of Economic Analysis. The contributors to the increase in the fourth quarter were increases in consumer spending and investment, which were partially offset by decreases in government spending and exports. Current-dollar GDP increased 5.1% at an annual rate in the fourth quarter. The personal consumption expenditures (PCE) price index increased 2.9%, compared with an increase of 2.8% last quarter. For 2025, real GDP increased 2.2%, compared with an increase of 2.8% in 2024, and the PCE price index increased 2.6%, the same as in 2024. -Delaney O’Kray-Murphy
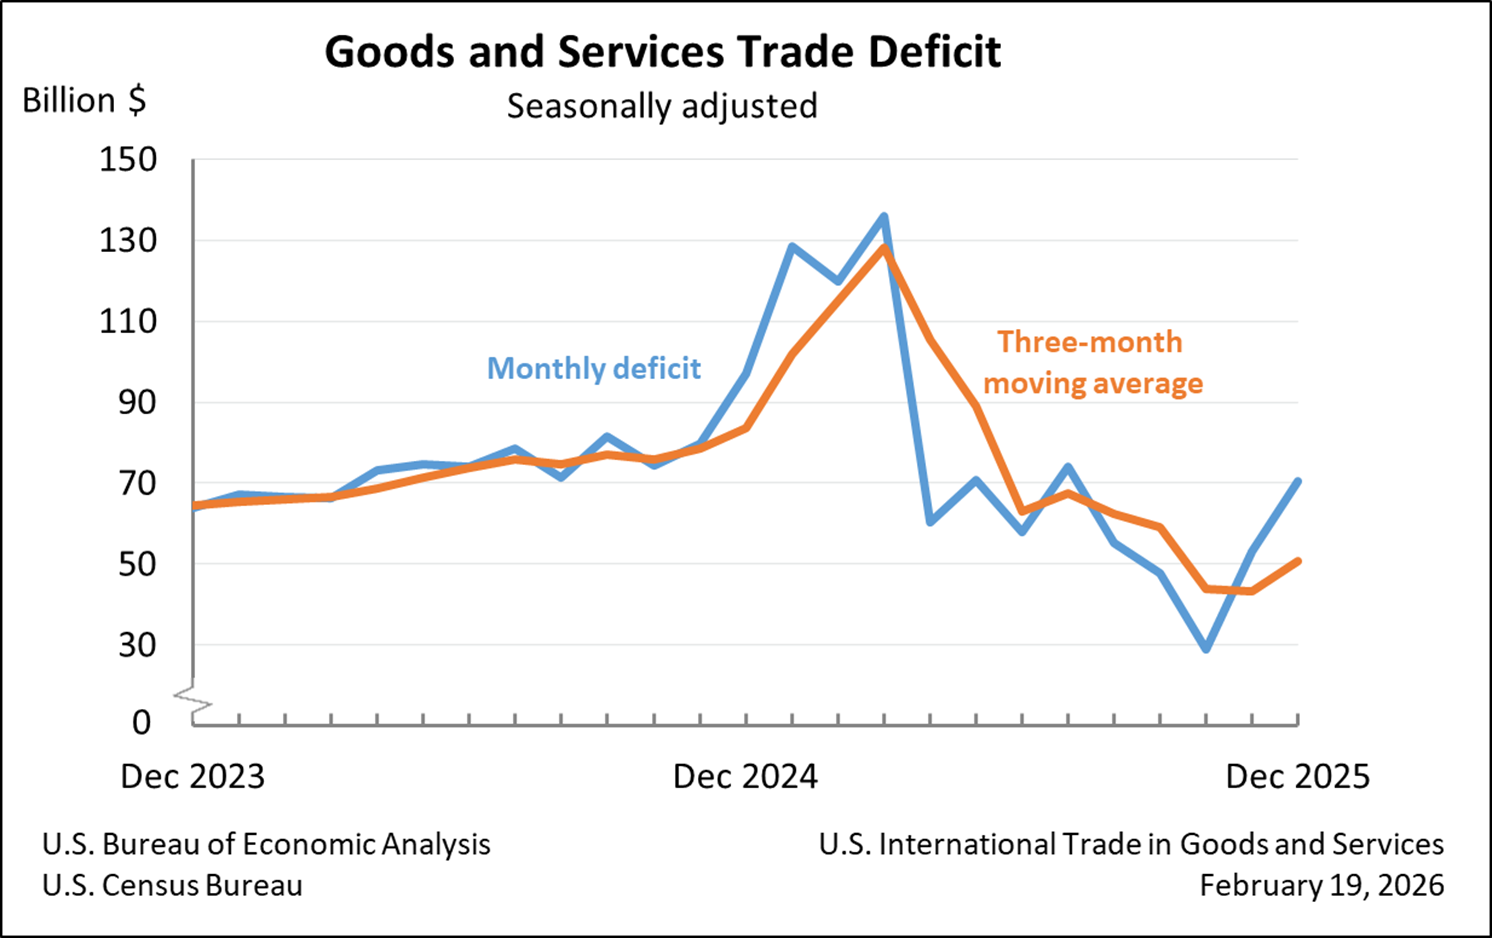
The December goods and services trade deficit came in at $70.3 billion, up $17.3 billion from a revised $53.0 billion in November. December exports fell $5.0 billion to $287.3 billion, and imports rose $12.3 billion to $357.6 billion. The increase in the deficit reflects an increase in the goods deficit of $15.7 billion to $99.3 billion and a decrease in the services surplus of $1.6 billion to $29.0 billion. For 2025, the goods and services deficit decreased $2.1 billion, or 0.2%, from 2024. Exports increased 6.2% to $199.8 billion, and imports increased 4.8% to $197.8 billion. The December figures show surpluses, in billions, with Netherlands ($5.6), South and Central America ($4.3), and United Kingdom ($3.7). The greatest deficits were with Taiwan ($19.8), Vietnam ($17.6), and Mexico ($14.5). -Delaney O’Kray-Murphy
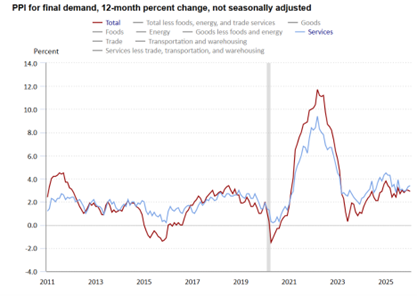
The U.S. Producer Price Index for final demand rose 0.5% over the month in January, its fastest pace since September 2025. Strong growth in January can be traced to final demand services, with strong gains in wholesale and retail margins. The index for final demand goods declined. The final demand index was up 3.4% over the year, slightly slower than the December 2025 reading of 3.5%. The index for processed goods for intermediate demand was unchanged over the month in January. The unprocessed goods for intermediate demand index moved down 0.5%. -George Hammond
Phoenix house prices were down 1.5% over the year in December based on the latest S&P Cotality Case-Shiller home price indices. Chicago reported the highest annual gain at 5.3%, followed by New York at 5.1%. Phoenix was among nine of the 19 currently reporting metropolitan areas with decreased house prices over the year (Detroit data are unavailable). Most of the metros with decreased prices were in the West and in Florida, with Tampa posting the largest decline in house price levels at -2.9%. The national home price index had an annual gain of 1.3% for December, and the 20-city composite similarly reported a 1.4% gain over the year. -Valorie Rice
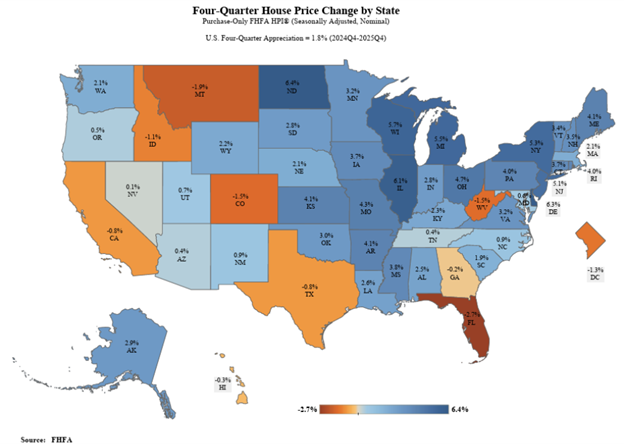
The U.S. Federal Housing Finance Agency (FHFA) reported U.S. house prices were up 1.8% over the year in the fourth quarter of 2025. Arizona had slight house price appreciation over the year, with a 0.4% increase in the fourth quarter of 2025. North Dakota led all states with a 6.4% increase, while ten states reported a decline in prices, Florida decreasing the most at -2.7% based on the purchase-only index. Most Arizona metropolitan areas reported annual gains in house prices for the fourth quarter of 2025, as reported with the all-transaction index (which includes sales prices and appraisal data). Lake Havasu City-Kingman reported no change in house prices over the year, while Yuma increased by 1.0%, Phoenix by 1.2%, Tucson by 2.2%, Sierra Vista-Douglas by 4.0%, Prescott Valley-Prescott by 4.7%, and Flagstaff by 5.7%. -Valorie Rice
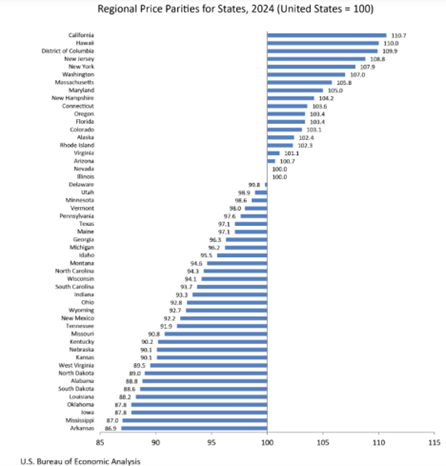
Real personal income increased in 46 states and the District of Columbia between 2023 and 2024, according to the U.S. Bureau of Economic Analysis (BEA). Arizona had a 3.3% increase in real personal income compared to 2.9% in the U.S. The changes in real personal income ranged from a decline of 2.2% in North Dakota to an increase of 5.5% in California. The release also included real personal consumption expenditures (PCE) by state, which are the current-dollar estimates adjusted by the corresponding regional price parity (RPP) and the national PCE price index. Arizona’s change in real PCE for 2024 was 4.0%. The current dollar PCE increased by 6.7% while its implicit regional price deflator increased 2.6%. Arizona’s regional price parity for all items placed near the national level, at 100.7 (where the nation equals 100). California had the highest RPP at 110.7, followed by Hawaii at 110.0, while on the other end of the spectrum, Arkansas had 86.9. All items cover all consumption goods and services, including housing rents, which are often the main driver. The RPP for housing in Arizona was 106.8, while it ranged from 54.2 in West Virginia to 154.3 in California. Regional price parities are still available for metropolitan areas, and most Arizona metropolitan areas report all item levels below the nation, with Sierra Vista-Douglas at 89.2, Yuma at 92.7, Lake Havasu City-Kingman at 94.1, Tucson at 96.9, Prescott Valley-Prescott at 98.3, Flagstaff at 100.3, and Phoenix at 103.3. -Valorie Rice
In December, Arizona over-the-year building permits saw a sizeable 88.0% increase to 6,157, not seasonally adjusted. The number of single-family units saw slight gains over the year, increasing 8.9% from last December to 2,639. The Phoenix MSA (Maricopa and Pinal counties) accounted for most of the permits in the state, with 4,959, a 113.6% increase. The number of single-family permits rose 19.1% to 1,653. The Tucson MSA saw sizeable increases as well, with total permits rising 117.9% to 669 while single-family permits fell 6.3% to 240. Of the counties, Cochise, Coconino, Maricopa, Pinal, Yavapai, and Yuma saw increases, while Apache, Gila, Graham, Mohave, Navajo, and Santa Cruz saw decreases. -Delaney O’Kray-Murphy
The December job openings rate decreased in six states and reflected little change in all other states and the District of Columbia. The largest decreases in job openings rate based on the December State Job Openings and Labor Turnover (JOLTS) release were in Vermont (-1.5 percentage points), New Hampshire (-1.4 points), New York (-1.2 points), and Rhode Island (-1.2 points). The rate for Arizona was 3.6%, down from 4.3% in November and 4.5% in October. Hire rates increased in just one state, declined in three states, and were little changed for all others. The states with decreases were New Hampshire, Maine, and Vermont, while Nevada posted an increase. Arizona’s hire rate of 4.0% was higher than the national rate of 3.3% for December. Separation rates increased in nine states, decreased in two states, and showed little movement in all other states and the District of Columbia. Arizona’s rate of 3.2% was similar to the U.S. at 3.3%. Nationally, there was little change in the job openings, hires, and total separations rates for December. The December report is the final monthly state-level JOLTS report. It will be replaced by an annual release that will be available in July. -Valorie Rice