Strong Growth but Stubborn Prices in the First Quarter
By: Delaney O’Kray-Murphy, EBRC Research Economist
Current data as of 1 May 2026
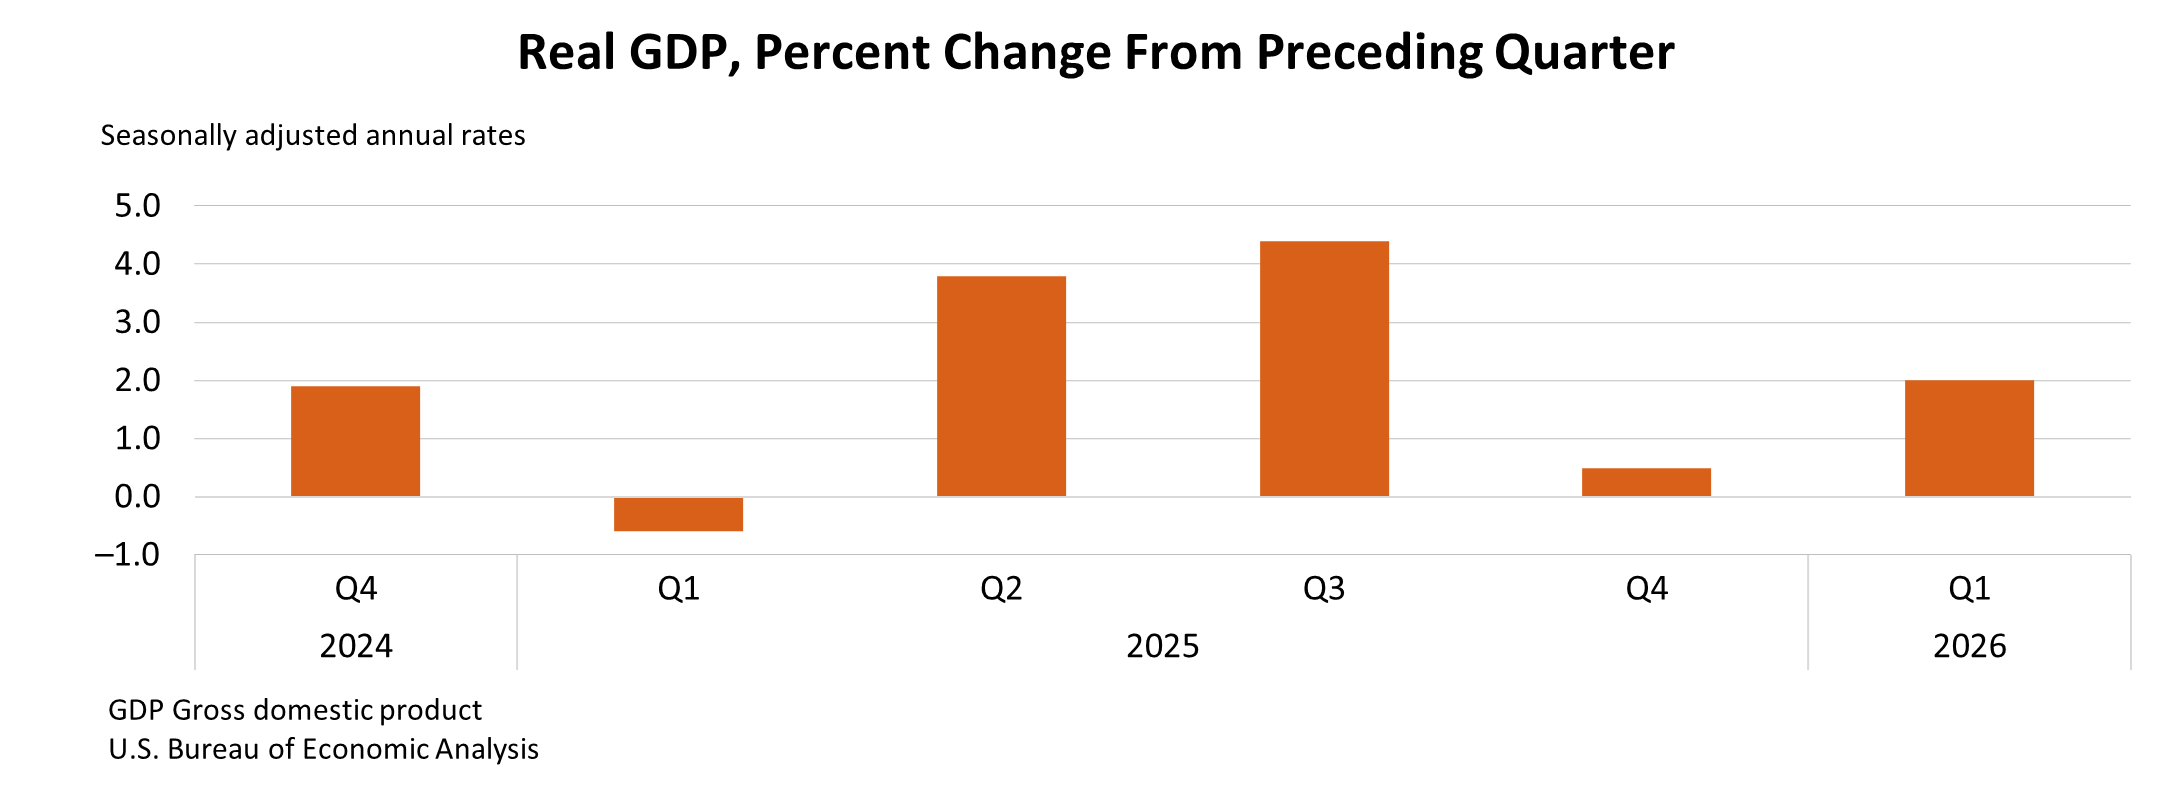
Real gross domestic product (GDP) increased at an annual rate of 2.0% in the first quarter of 2026, according to the advanced estimate released today by the U.S. Bureau of Economic Analysis. Investment, exports, consumer spending, and government spending contributed to the increase in real GDP, while imports, a subtraction from GDP, also increased. Real final sales to private domestic purchasers increased 2.5% in the first quarter, and the price index for gross domestic purchases increased 3.6% in the first quarter. The personal consumption expenditures (PCE) price index increased 4.5%.
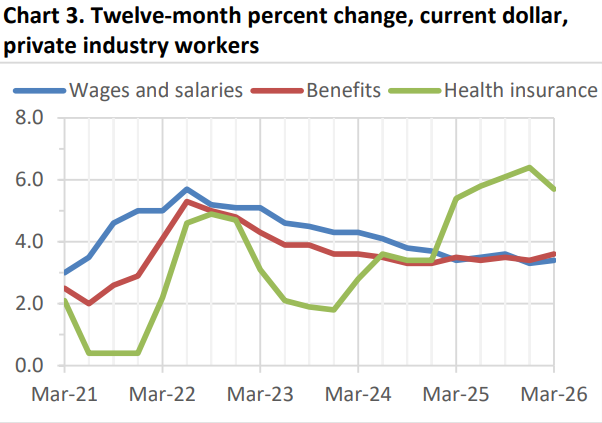
Compensation costs for civilian workers increased 0.9% on a seasonally adjusted basis for the three-month period ending March 2026, according to the U.S. Bureau of Labor Statistics. Wages and Salaries increased 0.8%, and benefits increased 1.2% from December 2025. For private industry workers, compensation costs rose 0.9% in the three months, while wages and salaries rose by 0.7%, and benefits costs increased by 1.3%. For state and local government workers, compensation costs rose by 1.0%, wages and salaries increased by 1.0%, and benefits increased by 1.2%.
U.S. house prices rose 0.7% over the year in February, down from a 0.8% rise in the previous month, based on the S&P CoreLogic Case-Shiller April 28th release. On the other hand, Phoenix home prices fell 1.8% in February, with similar declines also reported in Denver (2.2%), Seattle (2.0%), Tampa (2.1%), and Dallas (1.7%). Chicago reported the highest annual gain among the 20-city composite with a 5.0% increase in February, followed by New York and Cleveland with increases of 4.7% and 4.2%, respectively. Denver posted the lowest return in February, with a 2.2% decline. For the ninth consecutive month, inflation outpaced national home price appreciation, extending real home price declines.
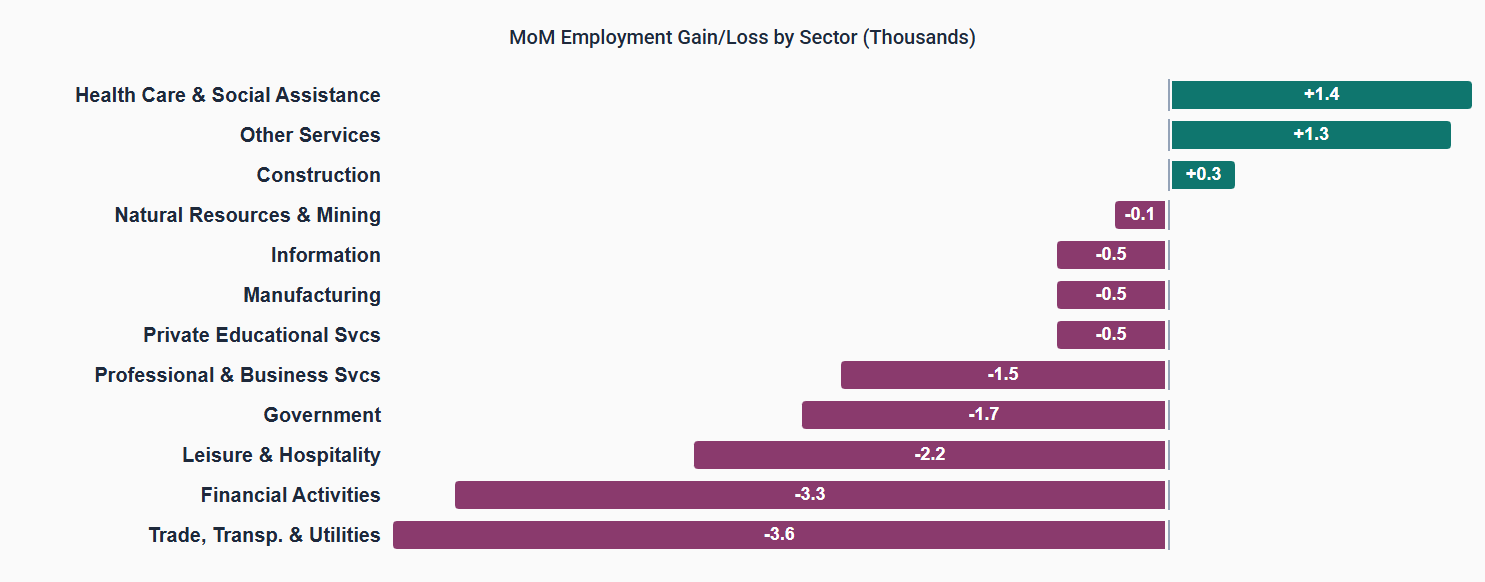
Total nonfarm employment in Arizona decreased by 17,800 jobs over the year in March, with the seasonally adjusted unemployment rate increasing 0.1 percentage points to 4.7% in March. The U.S. seasonally adjusted unemployment rate came in at 4.3% in March, 0.1 percentage point lower than in February. Arizona non-seasonally adjusted total nonfarm employment decreased by 10,900 jobs in February, below the pre-pandemic average of +10,800. Employment gains were reported in Health Care & Social Assistance (+1,400), Other Services (1,300), and Construction (300). Employment losses were reported in Trade, Transportation, & Utilities (-3,600), Financial Activities (-3,300), Government (-1,700), Professional & Business Services (-1,500), Private Educational Services (-500), Manufacturing (-500), Information (-500), and Natural Resources & Mining (-100).
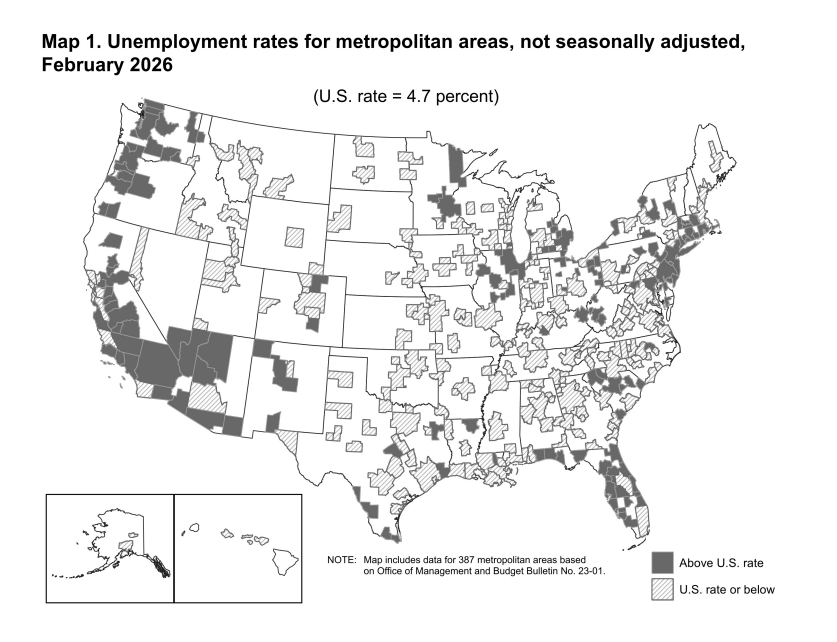
In February, year-over-year metropolitan unemployment rates were higher in 236 of the 387 metropolitan areas, lower in 110 areas, and unchanged in the remaining 41. The February unemployment rates for the Tucson and Phoenix metropolitan areas came in at 4.9% and 4.2%, respectively. Yuma had the highest unemployment rate in Arizona at 11.7%, while Phoenix had the lowest. Urban Honolulu, HI, had the lowest unemployment rate at 2.2%, while El Centro, CA, had the highest unemployment rate at 17.6%. The largest year-over-year increase in February occurred in Wildwood-The Villages, FL (+2.5 percentage points), while the most significant decrease was in Asheville, NC (-2.4 percentage points).
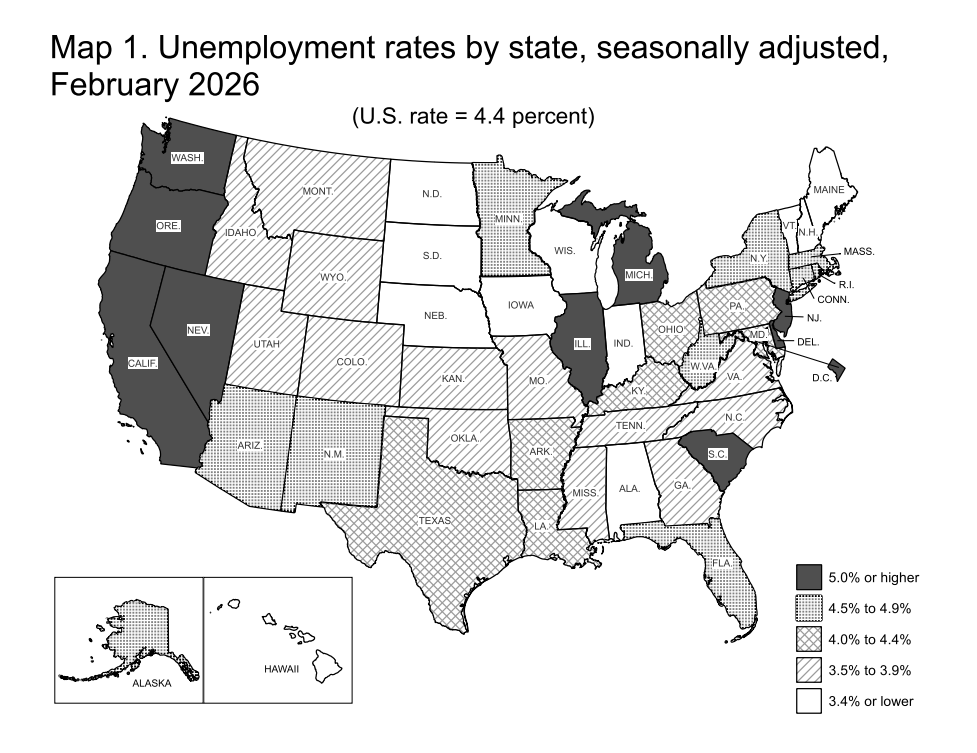
In February, month-over-month state unemployment rates were higher in one state and stable in the remaining 49 states and the District of Columbia. Arizona’s seasonally adjusted unemployment rate increased by 0.1 percentage point over the month to 4.7%, while the nation came in at 4.4%. Hawaii and South Dakota had the lowest jobless rates in February at 2.3% each, while the District of Columbia had the highest rate at 6.5%, followed by California and Delaware at 5.4% each. 13 states and the District of Columbia had unemployment rate increases year over year, the largest of which was in Delaware (+1.1 percentage points). The only year-over-year rate decreases occurred in Ohio (-0.7 percentage points) and Indiana (-0.5 percentage points).