

Bankruptcies Rising as Housing Tightens
By EBRC Research Staff
Data Releases as of 8/22/25
Bankruptcies in Arizona were up 13.4% in the first half of 2025 compared to the same period in 2024. There were 6,140 bankruptcies filed in the state during the first half of the year, compared to 5,414 in the first six months of 2024 and 4,588 for the same period in 2023. Bankruptcies increased 7.9% in the Tucson office (Cochise, Graham, Greenlee, Pima, Pinal, and Santa Cruz counties), 9.0% in the Yuma office (La Paz, Mohave, and Yuma counties), and 15.8% in the Phoenix office (Apache, Gila, Maricopa, and Navajo counties along with Coconino and Yavapai counties from the Prescott office). Chapter 13, individual debt, had the smallest change year-over-year, at 4.9%. Chapter 11 (reorganization) reflected the largest increase over the year for the state, with a rise of 59.3%, while Chapter 7 (liquidation) rose 14.8%. -Valorie Rice
The supply of existing homes remained unaffordable for most parts of the nation based on the National Association of Home Builders (NAHB)/Wells Fargo Cost of Housing Index (CHI). Nationally, a family earning the median income of $104,200 would need to spend 37% of their income on a median-priced existing home during the second quarter of 2025. Anything more than 30% is considered housing cost burdened. The two Arizona metropolitan areas included in the index fared better than the nation, with Tucson at 35% and Phoenix at 36%. The least housing cost burdened areas in the country for the second quarter were in Decatur, IL, at 17% and Elmira, NY, at 18%. On the other end of the spectrum, families earning the median income in San Jose-Sunnyvale-Santa Clara, CA, needed to spend 93% of their income on a median-priced existing home, and in Urban Honolulu, HI, it was 73%. -Valorie Rice
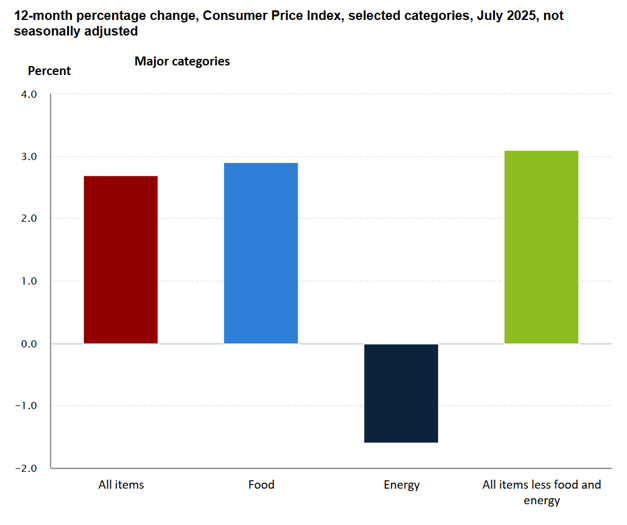
The U.S. all-items Consumer Prices Index (CPIU) rose 0.2% in July (seasonally adjusted), slower than the June increase of 0.3%. The CPIU less food and energy rose 0.3% in July, accelerating from 0.2% in June. Over the year, the all-items index was up 2.7% in July and the core index was up 3.1%. Declines in the energy index held down growth in the all-items index, while growth in shelter prices pushed it up. Food prices were up 2.9% over the year. The shelter index was up 3.6%. The core commodities index was up 1.2% over the year in July. – George Hammond
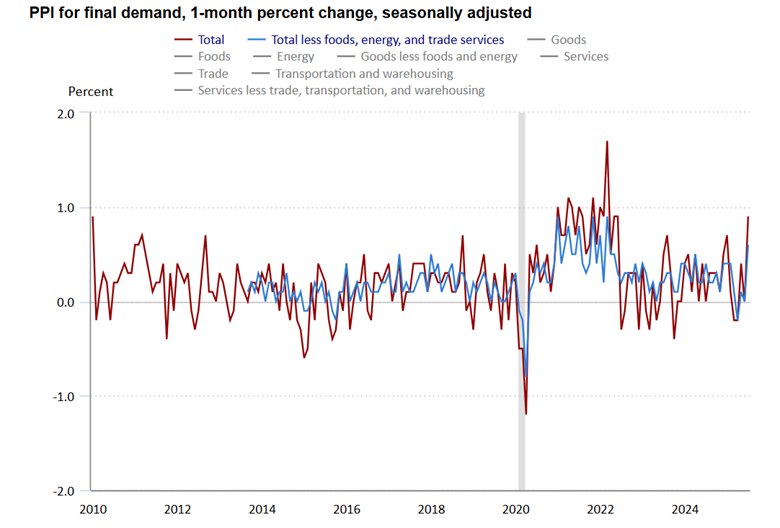
The U.S. Producer Price Index for final demand rose 0.9% over the month in July (seasonally adjusted), a significant acceleration over May and June. Over the year, the final demand index was up 3.3%, the fastest pace since February. Much of the increase in July was driven by final demand services, particularly margins for retailers and wholesalers. Final demand goods prices rose at a somewhat slower pace. A significant part of the increase in goods was attributable to fresh and dry vegetables. The price index for processed goods for intermediate demand rose 0.8% in July, while the price index for unprocessed goods rose 1.8%. – George Hammond
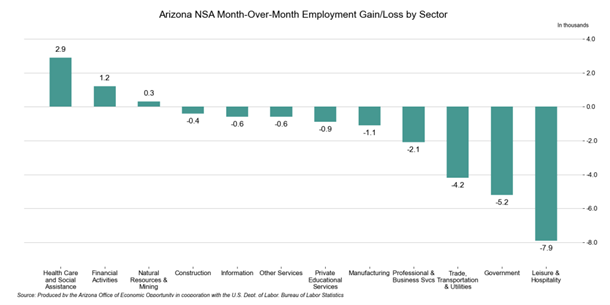
Total nonfarm employment in Arizona increased by 34,300 jobs over the year in July, with the seasonally adjusted unemployment rate remaining at 4.1%. The U.S. seasonally adjusted unemployment rate increased 0.1 percentage points over the month to 4.2% in July. Arizona non-seasonally adjusted total nonfarm employment decreased by 18,600 jobs in July, slightly better than the pre-pandemic average of -19,900. Employment gains were reported in Health Care and Social Assistance (2,900), Financial Activities (1,200), and Natural Resources & Mining (300). Employment losses were reported in Leisure & Hospitality (-7,900), Government (-5,200), Trade, Transportation, & Utilities (-4,200), Professional & Business Services (-2,100), Manufacturing (-1,100), Private Educational Services (-900), Information (-600), Other Services (-600), and Construction (-400). -Delaney O’Kray-Murphy
The June state-level Job Openings and Labor Turnover (JOLTS) release indicated that job openings rates decreased in four states, rose in one state, and were little changed in all others. The job openings rate in Arizona for June was 4.4%, matching the U.S. total at 4.4%. California was the one state with an increase, moving up 0.4 point to 3.8%. California was also the only state to have an increase in the number of job openings (+73,000), while the heaviest decreases were in Texas (-75,000), New York (-66,000), and Georgia (-42,000). Hire rates fell in 11 states, increased in one state, and changed little in all others. The largest decrease in hires rates was in Idaho (-1.6 percentage points), while the increase was in Texas (+0.6 point). The hires rate for Arizona fell -0.9 percentage points between May and June to 3.6%. Nationally, the number and rate of separations changed little over the month. There were three states with a drop in the number of separations, two that experienced an increase, while most states had no significant change. Florida had the largest decrease (-61,000), while California had the largest increase (+83,000). -Valorie Rice
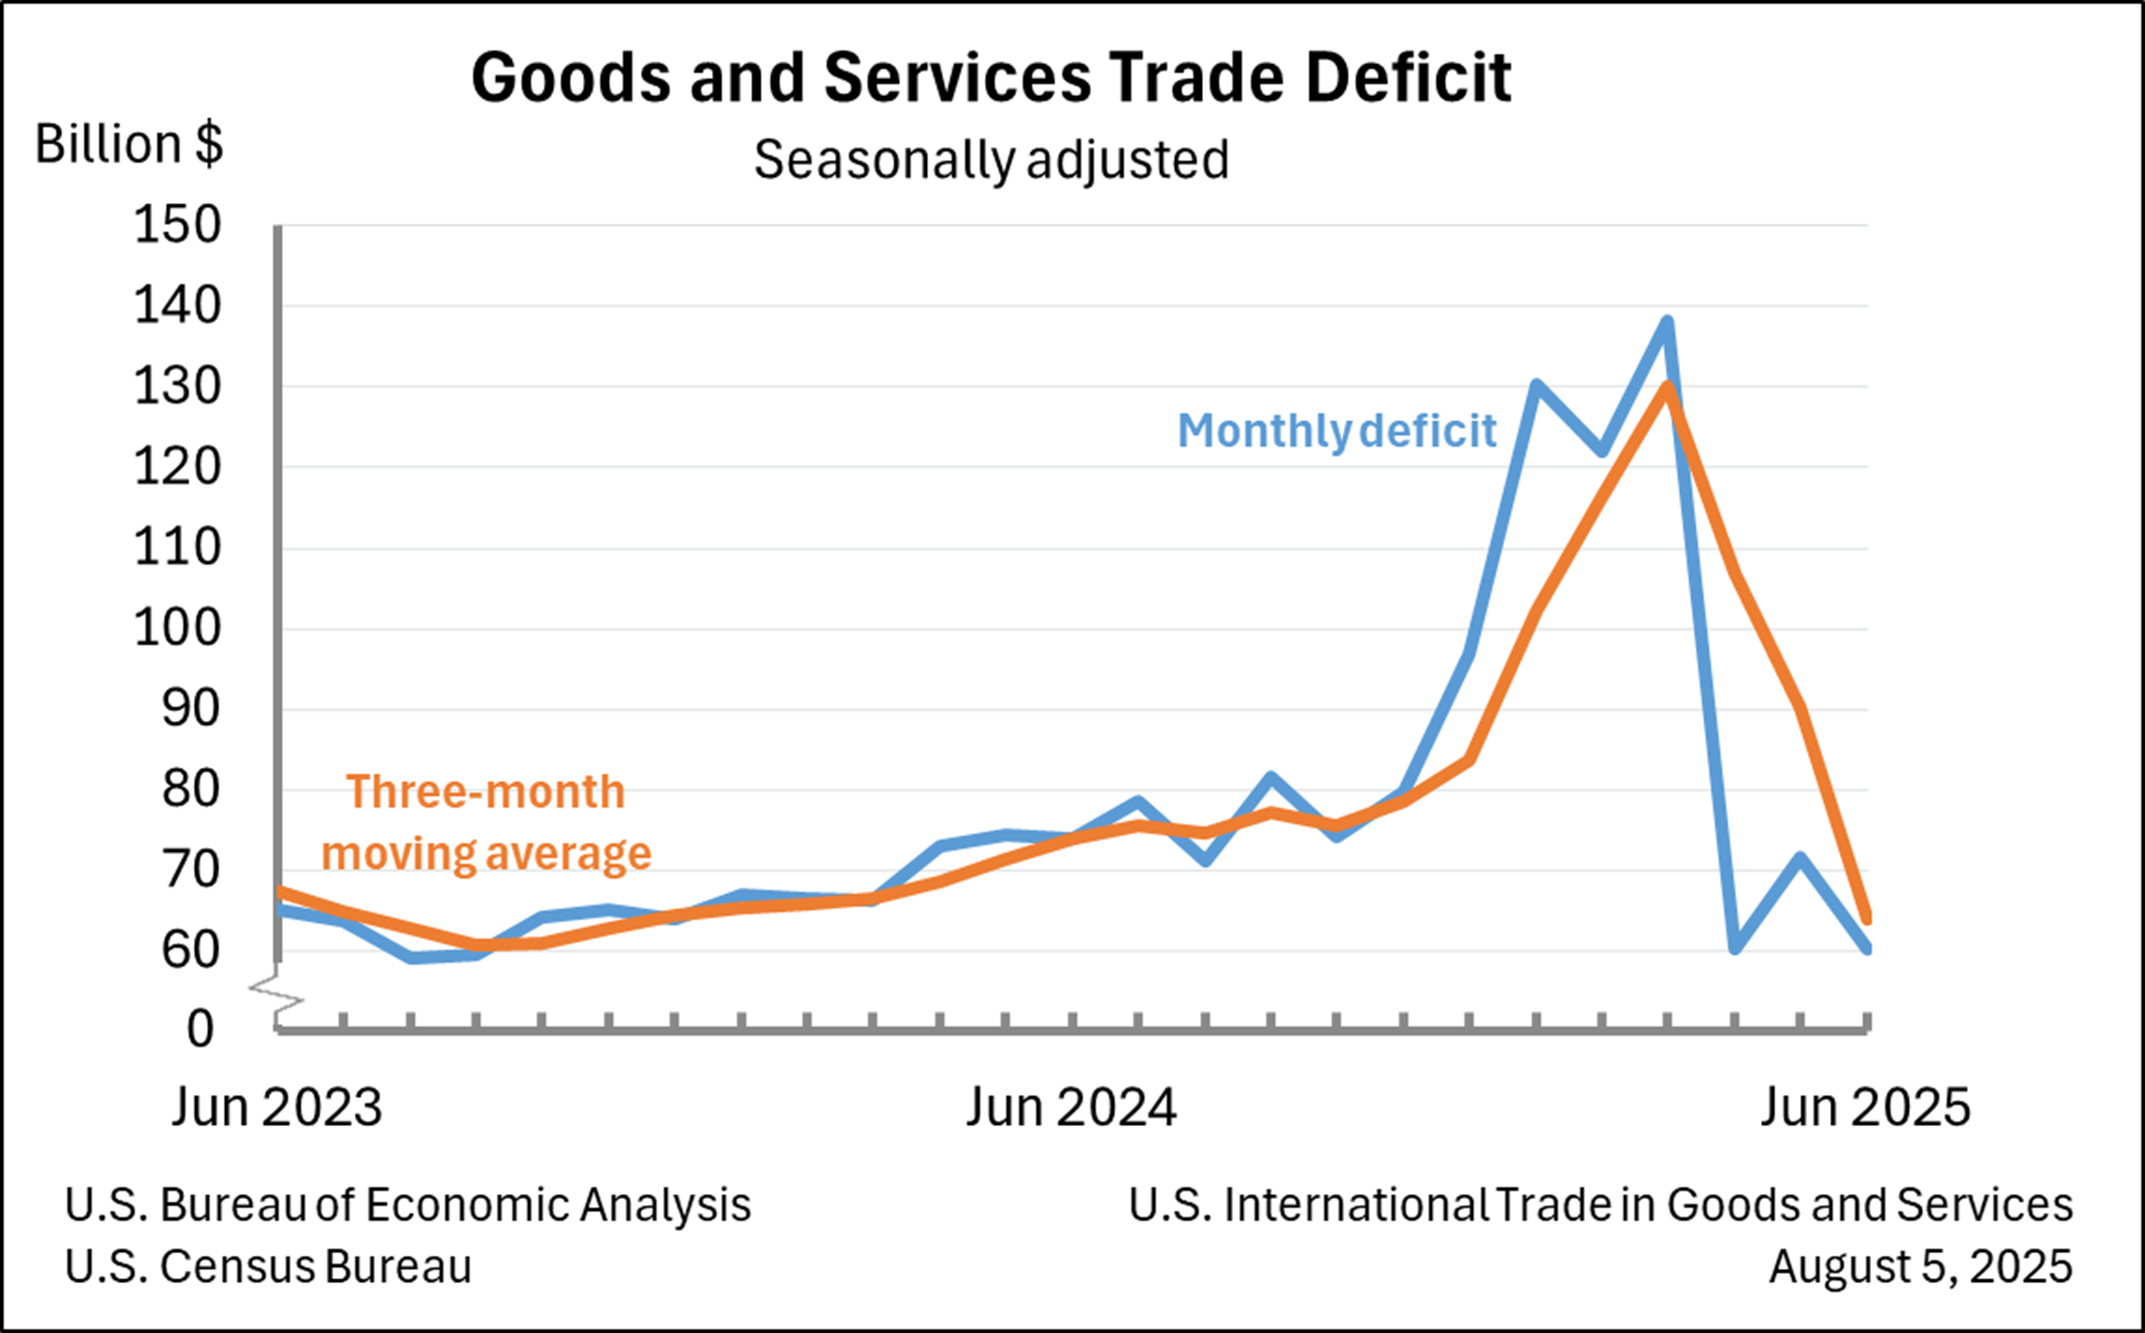
The June goods and services trade deficit came in at $60.2 billion, down $11.5 billion from a revised $71.7 billion in May. June exports fell $1.3 billion to $277.3 billion, and imports fell $12.8 billion to $337.5 billion. The decrease in the deficit reflected a decrease in the goods deficit of $11.4 billion to $85.9 billion and an increase in the services surplus of $0.1 billion to $25.7 billion. Year-to-date, the goods and services increased $161.5 billion, or 38.3%, compared to the same period last year. The largest surpluses, in billions, occurred with Netherlands ($6.2), South and Central America ($4.4), and United Kingdom ($2.2), while the greatest deficits were with Mexico ($16.3), Vietnam ($16.2), and Taiwan ($12.9). -Delaney O’Kray-Murphy
In July, over the month state unemployment rates were higher in one state, lower in two states, and stable in the remaining 47 states and the District of Columbia. Arizona’s seasonally adjusted unemployment rate remained at 4.1% over the month but increased 0.5 percentage points over the year. South Dakota had the lowest unemployment rate in July at 1.9%, while the District of Columbia had the highest unemployment rate of 6.0%. 17 states and the District of Columbia had unemployment rate increases over the year, the largest of which was in Mississippi (+0.9 percentage points), while five states had year-over-year rate changes, the largest of which was in Indiana (-0.7 percentage points). -Delaney O’Kray-Murphy


