

Middle East Conflict Drives Inflation Surge in Early 2025
By: EBRC Research Staff
Current data as of 17 April 2026
The U.S. Consumer Price Index for All Items increased 0.9% over the month in March, up from a 0.3% increase in February. The March increase was primarily driven by a 21.2% over-the-month increase in gasoline, reflecting the impact of the Iran war. Over the year, the all-items index increased 3.3%, with the gasoline index up 18.9%. The March over-the-year rise was the fastest since May 2024. The all-items less food and energy index rose 2.6% over the year in March, up slightly from 2.5% in February. The energy index increased 12.5% and the food index rose 2.7%. -George Hammond
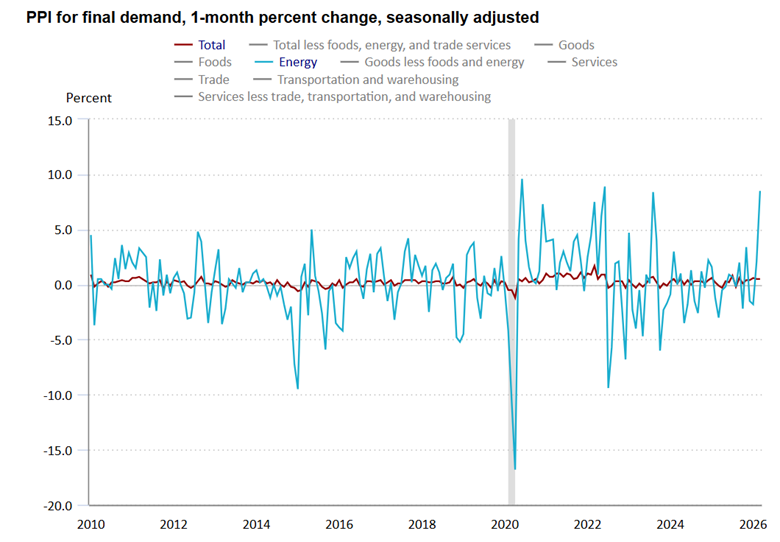
The U.S. Producer Price Index for final demand rose 0.5% over the month in March, unchanged from February. That increase was driven by final demand goods, because final demand services prices were unchanged. In turn, the increase in the final demand goods index reflected a significant rise in energy prices (primarily gasoline, diesel fuel, and jet fuel due to the war in the Middle East). Over the year, the final demand index increased 4.0%, its fastest increase since early 2023.
The index for intermediate demand for processed goods rose 2.6% in March (fastest since mid-2022), while the index for unprocessed goods fell 2.6%. The services index was down 0.1%. Processed energy goods were up significantly in March, reflecting rising gasoline, diesel, and jet fuel prices. Unprocessed energy goods declined in March, reflecting a drop in natural gas prices. -George Hammond
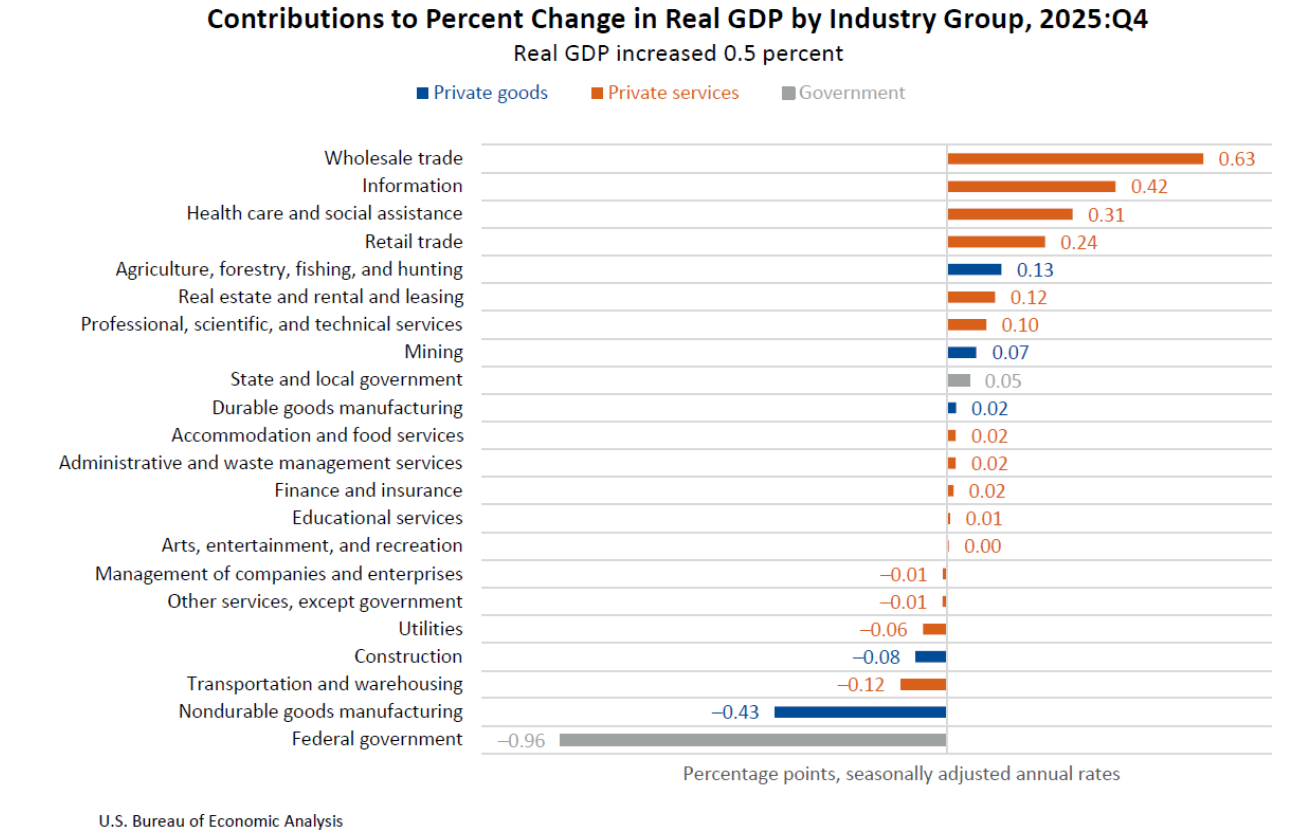
Real gross domestic product (GDP) increased at an annual rate of 0.5% in the fourth quarter of 2025, according to the third estimate released by the U.S. Bureau of Economic Analysis. Real GDP was revised down by 0.2 percentage points from the second estimate, primarily reflecting a downward revision to investment. At an industry level, the increase in real GDP reflected an increase of 2.3% in real value added for private services-producing industries that was partly offset by decreases of 7.8% in government and 1.8% in private goods-producing industries. The leading contributors to the increase in real GDP were wholesale trade, information, and health care and social assistance. The estimate for real GDI, an alternate measure to GDP, came in at 2.6%, setting the average of real GDP and real GDI at 1.5%. -Delaney O’Kray-Murphy
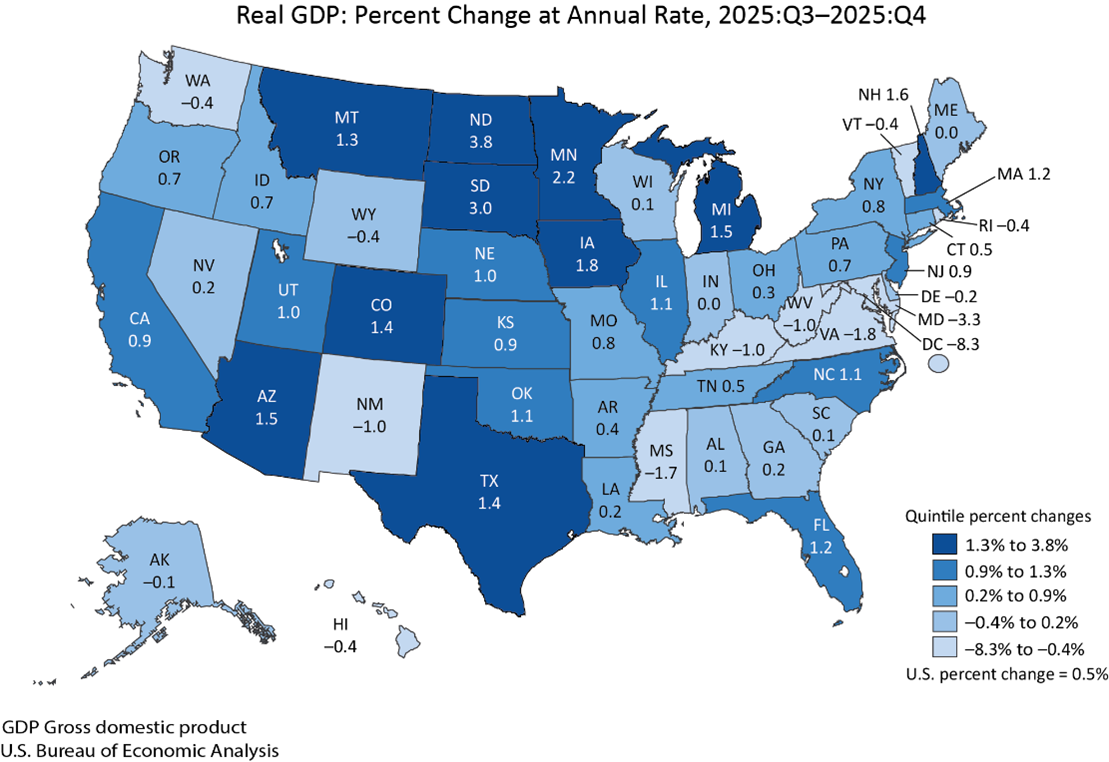
Arizona real GDP increased by 1.5% at an annual rate from the third to the fourth quarter of 2025, according to the Bureau of Economic Analysis’ April 9th release. This tied Arizona for 6th in the nation alongside Michigan, both in the highest quintile. Wholesale trade was the largest contributor to GDP in Arizona, contributing 0.56 percentage points, followed by Information, with 0.53 percentage points. On the other hand, Government showed the largest decrease in state GDP for Arizona, detracting 0.68 percentage points, followed by Manufacturing, with a 0.11 percentage point decrease. North Dakota showed the largest increase in state GDP with a growth of 3.8%, while the District of Columbia ranked last with -8.3%. -Delaney O’Kray-Murphy
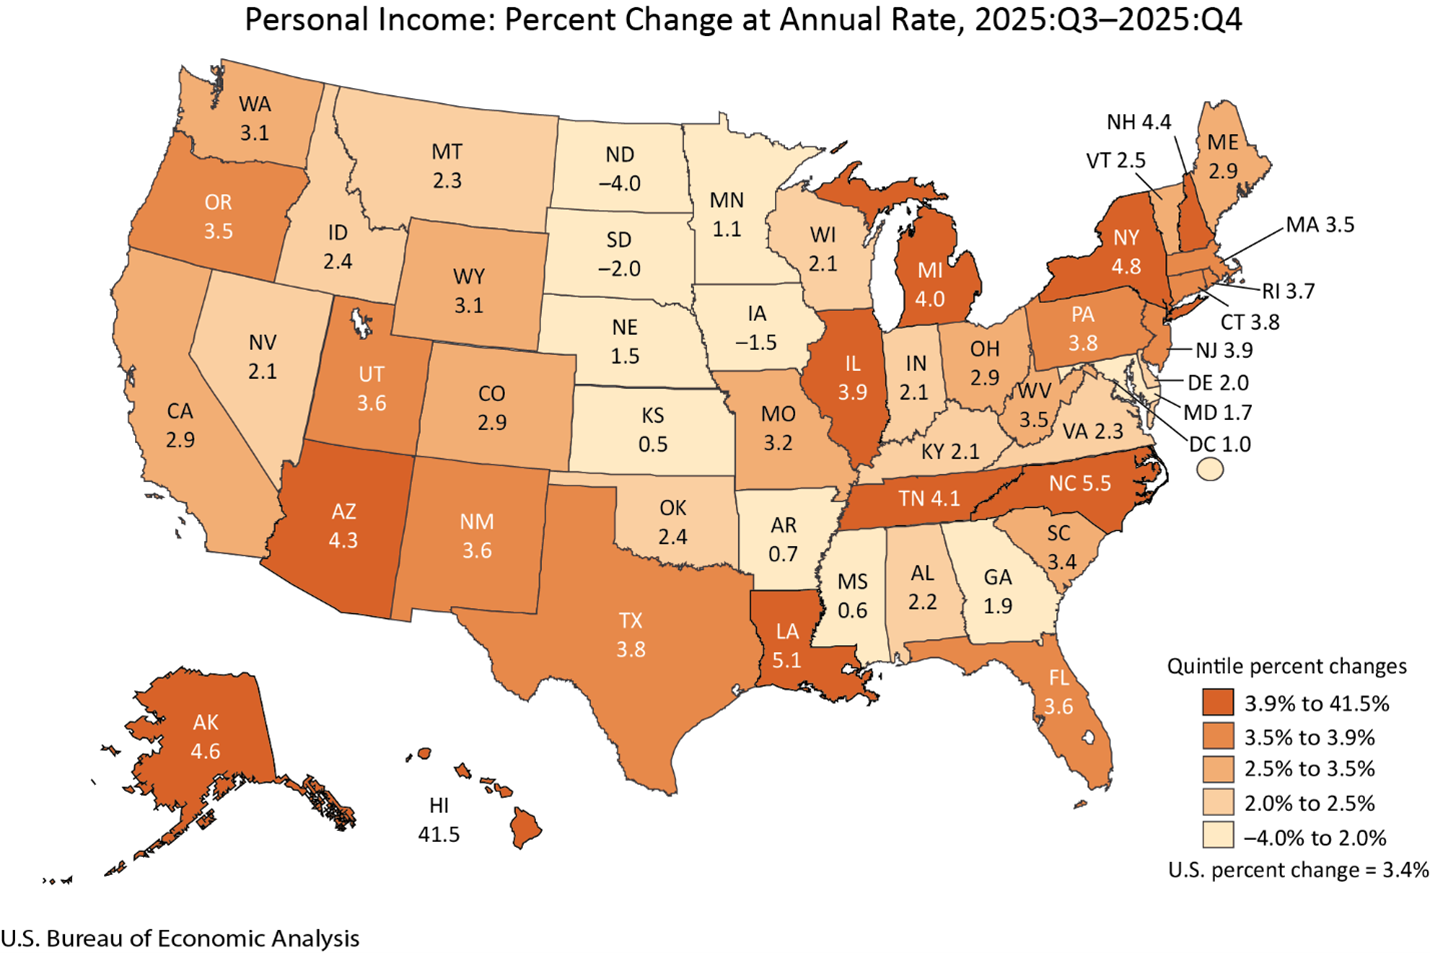
Arizona personal income increased at an annual rate of 3.4% in the fourth quarter, ranking it in the top quintile. Personal income increased in 47 states and the District of Columbia, with Hawaii ranked first with a growth of 41.5%. Conversely, North Dakota showed the most significant decrease in personal income, falling 4.0%. Nationally, current-dollar personal income increased $217.9 billion, or 3.4% at an annual rate. Earnings increased in 43 states, ranging from 5.9% in Massachusetts to -7.1% in North Dakota. Property income increased in all 50 states and the District of Columbia, ranging from 2.6% in Wyoming to 0.9% in West Virginia. -Delaney O’Kray-Murphy
In January, month-over-month state unemployment rates were higher in one state and stable in the remaining 49 and the District of Columbia, according to the Bureau of Labor Statistics’ April 8 release. Arizona’s seasonally adjusted unemployment rate increased by 0.1 percentage points over the month to 4.5%. Hawaii and South Dakota had the lowest jobless rates in January at 2.2% each, and the District of Columbia had the highest unemployment rate at 6.7%. 14 states and the District of Columbia had unemployment rate increases over the year, the largest of which was in Delaware (+1.3 percentage points), and the only decreases over the year were in Indiana and Ohio (-0.5 percentage points each). -Delaney O’Kray-Murphy
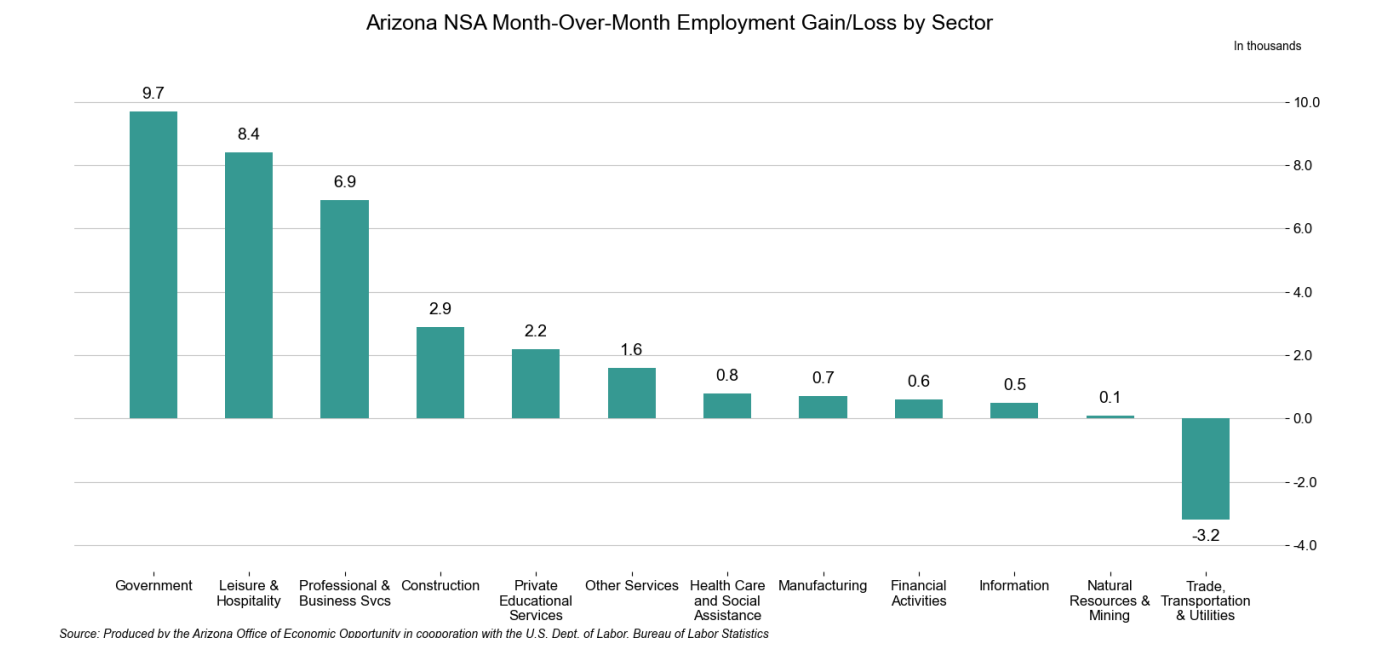
Total nonfarm employment in Arizona decreased by 5,400 jobs year-over-year in February, with the seasonally-adjusted unemployment rate rising a tenth of a percentage point to 4.6%. The U.S. seasonally-adjusted unemployment rate similarly increased a tenth of a percentage point up to 4.4%. Arizona non-seasonally adjusted total nonfarm employment increased by 31,200 jobs in February, higher than the pre-pandemic average of 25,100. Employment gains were reported in Government (9,700), Leisure & Hospitality (8,400), Professional & Business Services (6,900), Construction (2,900), Private Educational Services (2,200), Other Services (1,600), Health Care and Social Assistance (800), Manufacturing (700), Financial Activities (600), Information (500), and Natural Resources & Mining (100). Employment losses were reported in Trade, Transportation, & Utilities (-3,200). Health Care and Social Assistance saw the largest year-over-year gains (10,300), while Government saw the most significant losses (-8,400). -Delaney O’Kray-Murphy
In January, year-over-year metropolitan unemployment rates were higher in 252 of the 387 metropolitan areas, lower in 101, and unchanged in the remaining 34. The January unemployment rates for the Tucson and Phoenix metropolitan areas came in at 5.1% and 4.4%, respectively. Yuma had the highest unemployment rate in Arizona at 11.4%, and Phoenix had the lowest. Urban Honolulu, HI, had the lowest unemployment rate in the country at 2.1%, while El Centro, CA, had the highest rate of 18.6%. The largest year-over-year increase occurred in Wildwood-The Villages, FL (+2.4 percentage points), and Asheville, NC, had the largest year-over-year decline (-2.4 percentage points). -Delaney O’Kray-Murphy


