
Arizona’s Personal Income Growth Closed 2025 Strong
By George Hammond, Research Professor, EBRC
Arizona’s output per worker soared in 2024 and 2025
Arizona nominal personal income rose 4.3% over the quarter in the fourth quarter of 2025, at a seasonally adjusted annual rate. That was well above the national pace of 3.4%. Arizona’s rate ranked it 7th in the nation (including D.C.), behind Hawaii, North Carolina, Louisiana, New York, Alaska, and New Hampshire. At the other end of the spectrum, personal income declined in North Dakota, South Dakota, and Iowa. (Exhibit 1). Arizona’s pace improved from the third quarter rate of 3.4%.
Exhibit 1: Personal Income Growth by State, Over the Quarter, Fourth Quarter of 2025, Percent
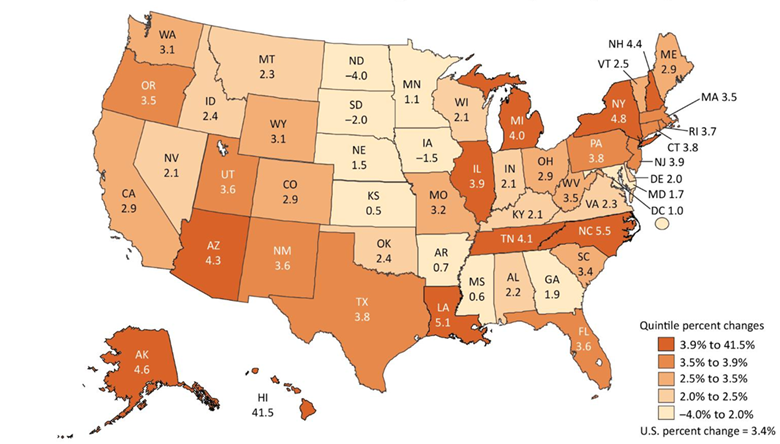
In the fourth quarter, Arizona net earnings from work (wages and salaries, proprietor’s income, fringe benefits) rose 5.7% at an annual rate, well above the national pace of 4.0%. For Arizona, that was by far the fastest pace of the year. Income from dividends, interest, and rent rose 1.7%, equaling the national pace. Transfer receipts (Social Security, Medicare, Medicaid, welfare, etc.) rose 3.0% in Arizona and 3.2% nationally.
With the release of the fourth quarter of 2025 data, we now have the preliminary full-year results. Arizona personal income rose 4.3% over the year in 2025, slower than the national pace of 4.9% and slower than the 5.9% increase in the state in 2024. Arizona net earnings from work rose just 3.7% over the year last year, compared to 4.7% nationally. Arizona income from dividends, interest, and rent rose 2.5% (2.1% nationally) and transfer receipts rose 8.1% (8.7% nationally).
Arizona’s per capita personal income last year hit $68,283, which was up 3.4% from 2024. This per capita personal income level relies on the population estimates from the U.S. Census Bureau, not those from the Arizona Office of Economic Opportunity. That was below the U.S. pace of 4.3%. U.S. per capital personal income was $76,393 last year. Arizona’s per capita personal income ranked 36th in the nation last year (including D.C.), down from 33rd in 2024 (Exhibit 2). In percentage terms, the state’s per capita personal income was 89.4% of the national average, down from 90.2% in 2024.
Exhibit 2: Per Capita Personal Income by State, Current Dollars, 2025
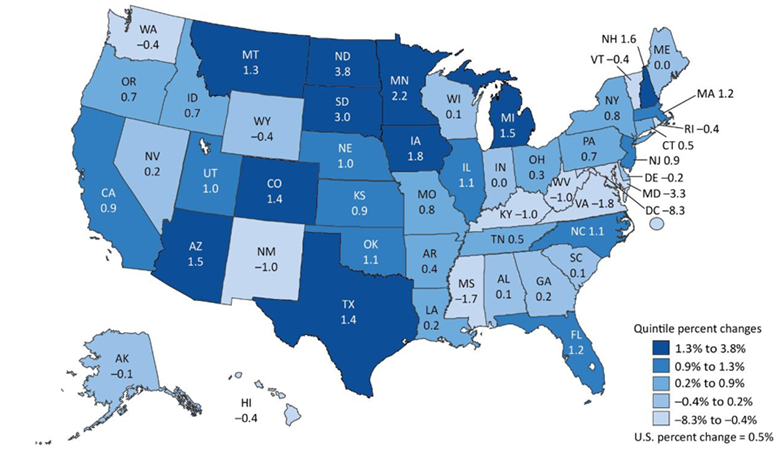
Arizona real GDP rose 1.5% over the quarter in the fourth quarter of 2025 (seasonally adjusted annual rate), substantially faster than the national average increase of 0.5% (Exhibit 3). Sectors generating the fastest growth in Arizona were information; mining; arts, entertainment, and recreation; agriculture; and wholesale trade. Real GDP in federal civilian government declined, as did activity in the military, utilities, manufacturing (including both durable and nondurable goods), transportation and warehousing, construction, state and local government, and management of companies.
Exhibit 3: Real GDP Growth by State, Over the Quarter, Fourth Quarter of 2025, Percent
As with personal income, we now have preliminary annual real GDP data for 2025. The estimates suggest that Arizona real GDP rose by 2.0% last year (similar to the U.S. at 2.1%), which was down from 4.5% in 2024. Sectors generating the fastest growth in Arizona last year were finance, insurance, and real estate; professional and business services; private education and health services; and information. Real GDP was down last year in manufacturing; leisure and hospitality; other services; and government.
Since 2024, Arizona’s real GDP growth has substantially outpaced job growth, with jobs measured by data from the Current Employment Statistics program. Indeed, Arizona’s job growth in 2024 was 1.9% in 2024 and 0.1% last year.
Taken together, the real GDP and job data point to a substantial acceleration in output per worker during the past two years. Indeed, growth in real GDP per worker accelerated from 0.6% in 2023, to 2.5% in 2024, and 1.8% last year.
The reasons for this sudden acceleration in output per worker are not yet clear. One way to explore this question is to disaggregate overall growth in output per worker by major industry. Exhibit 4 shows the results for 2024 and 2025. Specifically, it shows contributions to the net increase in real GDP per job in 2024 and 2025, broken out by industry. Note that these are the contributions to output per worker measured in thousands of chained 2017 dollars per job, not the growth rate in output per worker.
Exhibit 4: Arizona Contributions to Growth in Real GDP per Job by Industry in 2024 and 2025, Thousands of Chained 2017 Dollars per Job
In 2024, the industries contributing the most to the increase in real GDP per job were financial activities; trade, transportation, and utilities; construction; and private education and health services. In 2025, the pattern of contributions is somewhat similar, with the largest coming from financial activities; professional and business services; and private education and health services.
While it is possible that recent advances in generative artificial intelligence contributed to productivity gains in the fastest rising sectors, it is important to be cautious. Strong gains during the last two years seem a bit early to be primarily driven by advances in the large language models (LLMs) which are now getting so much attention. However, there are other forms of artificial intelligence that may have contributed, such as advances in data analytics, robotics, etc. Whatever the source of the growth, the data clearly suggest significant increases in Arizona’s labor productivity recently.