

By Alberta H. Charney, Ph.D.
Senior Research Economist
November 1, 2013
Contents:
- Introduction
- The Data
- Total General Fund Tax Revenue
- Disappearance of General Fund Revenue Sources
- Current Sources of Tax Revenue to General Fund
- Conclusion
- References
Introduction
In the Arizona’s Economy article Arizona’s General Fund Operating Expenditures: 1979 – 2013, patterns of general fund expenditures were examined from FY1982 through FY2012. That article examined priorities within the economic conditions surrounding state spending decisions. This article examines the sources of the money deposited into the general fund. After initial examination, it was determined that this article would have to be limited only to general fund tax revenues; non-tax revenues would not be considered.
There were several reasons why non-tax revenues were excluded. The main reason is the extreme volatility of those revenues. That volatility did not stem from economic conditions that made the non-tax revenues grow and shrink as do tax revenues. All too often it was associated with definitional/accounting changes where sometimes items were included in non-tax revenue and sometimes they weren’t. For example, at one time, university tuition was deposited into the general fund as part of non-tax revenue, as were medical payments made to the University of Arizona hospital. These were removed completely from the general fund.
Currently, a portion of university tuition and fees enter the appropriations process as non-general fund revenue and what was once the University of Arizona Hospital is now the separate entity, the University Medical Center. For a time, lottery money, which are non-tax revenues since participation is voluntary, was included in the general fund but then it was removed and allocated separately. In FY2012, $165 million from state lotteries were allocated to economic development, education, environment and health and public welfare funds without ever being deposited into the general fund.
Non-tax revenues also include one-time or short-term transfers into the general fund from other funds. This typically occurs during downturns. For example, $1.3 billion in FY2009 and more than $2 billion in FY2010 was entered into the general fund as a “net revenue enhancement/one-time adjustment.” Some of this was the federal stimulus money sent to states so they could maintain reasonable levels of operation and a substantial amount was from within-state budget transfers.
For all these reasons, the non-tax portion of the general fund is extremely volatile over time. As a percentage of total tax revenue deposited into the general fund, non-tax revenues vary from as little as 2.6 percent in FY1990 to 37.3 percent in FY2010. In addition to the volatility, the aggregation of various components changed over time, so in some years more detail was reported than in other years. This made it extremely difficult to form consistent series for the subcategories of non-tax revenues. Because of the inconsistencies over time in the data, the inability to consistently identify certain components over the time period, and the lumpy transfers from other state and federal sources, non-tax revenues of the general fund will not be discussed further in this article.
back to topThe Data
General fund revenue data from FY1997 through FY2012 were obtained from the Joint Legislative Budget Committee website [1]. Data from FY1982 through FY1996 were obtained from corresponding State of Arizona Annual Financial Reports (not available on-line). Revenue categories were defined consistently throughout this period, with only a few exceptions, and those inconsistencies were easily reconciled.
For FY1993 AND FY1994, data for four tax categories (luxury, insurance premiums, parimutual and estate taxes) had to be estimated because the Annual Financial Reports for those years aggregated them into “other” tax revenue. Since this is intended to be an examination of long-term trends rather than a look at specific years, the revenues for those four categories for those two years were estimated using a simple interpolation between the FY1992 and FY1994 values.
Total General Fund Tax Revenue
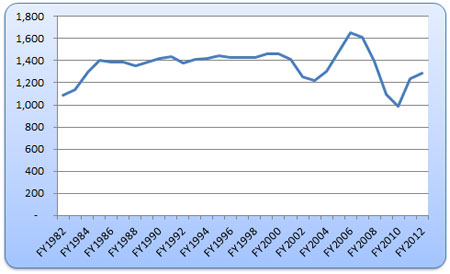
Figure 1: Total Revenues to the General Fund
Deflated per capita $2012
Figure 1 presents the graph of total general fund tax revenues. In FY1982, Arizonans paid just under $1,084 per person in 2012 constant dollars ($2012). That figure jumped to approximately $1,400 by FY1985, where it remained steadily through FY2001. After FY2001, total tax revenues became extremely volatile. The relatively short recession that began and ended in 2001 drove general fund tax revenues down to an average of $1,237 in FY2002 – FY2003, a substantial decrease. The rapid expansion in Arizona’s economy from FY2004 through FY2007 associated with the housing bubble drove total general fund tax revenues up to over $1,650 per person (in $2012). The economic and fiscal crises that followed drove per capita general fund revenues down to $989, by far the lowest point during the entire 31-year period. Since then, per capita revenues have rebounded somewhat, returning to $1,284 in FY2012. In FY2012, per capita constant general fund tax revenues were $76 below the FY1982-FY2011 average of $1,360 and more than $130 below the $1,414 average of the stable FY1985 – FY2001 period. The rest of this article examines each of the taxes in the general fund to determine which contribute the most and to identify changes that have occurred over time.
The Disappearance of General Fund Revenue Sources
Table 1 presents tax revenues to the general fund, by category, in 5-year intervals from FY1982 through FY2012, along with the percent contribution of each tax. Because FY2012 includes the 1 percent temporary sales tax, which ended in mid-2013, the percent contributions are computed both with and without the temporary tax for that year.
")
Table 1: Total General Fund Tax Revenues ($ Thousands and % Share)
A cursory examination of tax sources to the general fund shows that five of the tax sources (six if “other” is counted) have all but disappeared. Those revenue sources – property, motor vehicle license, luxury, parimutual, estate and “other” taxes – contributed 16 percent of all general fund tax revenue in FY1982. In FY2012, these same revenue sources represented just 1 percent of the general fund. On a per capita basis in $2012, general fund revenues from these six tax sources went from $174 in FY1982 to $11 in FY2012 (Figure 2). Two of the taxes – state property taxes and estate taxes – were repealed and the others have largely been reallocated away from the general fund and earmarked for specific purposes.
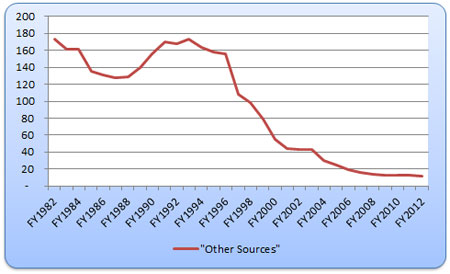
Figure 2: Revenues to the General Fund – Other Sources*
Deflated per capita $2012
Estate Tax
The estate tax was imposed on the transfer of wealth when an estate owner dies. The amount of Arizona’s estate tax was set equal to the maximum allowable federal tax credit for state death taxes under the Internal Revenue Code [2]. When the federal government repealed the federal tax credit for state death taxes in 2004, Arizona’s tax effectively ended on that date and, rather than rewrite the statute to impose the tax using a different base, the state statute was repealed in 2006. The tiny amounts of estate taxes still appearing are from estate settlements pre-dating the 2006 repeal.
Property Taxes
Counties, cities, school districts and a wide variety of special districts, e.g., lighting districts, flood districts, all rely on property taxes. At one time, Arizona also had a state-wide property tax that was deposited into the general fund. The state property tax was repealed in 1996 [2]. However, small amounts of property taxes continue to be deposited into the general fund. These are state taxes imposed on properties that are not located within any school district or on property in certain school districts that are ineligible for state aid. Essentially, when the school portion of a property’s tax is extremely low, the state imposes a type of minimum property tax. In addition, there is a state-mandated county equalization tax, imposed by counties. The result of the 1996 state property tax repeal was to reduce the property tax contribution to the general fund from 6.8 percent in FY1982 to 0.2 percent in FY2012.
Motor Vehicle License Tax
The motor vehicle license tax is imposed on the value of a car and, as such, the tax imposed on any given car diminishes each year as it depreciates. Currently, the legislated depreciation rate is 16.25 percent each year. In FY1982, revenues from the motor vehicle license tax comprised about 2.5 percent of total general fund revenues. In 2012, this tax comprised 0 percent. Unlike the state property tax and estate tax, which were repealed, the motor vehicle license tax continues to be imposed but none of it is currently deposited into the general fund.
The motor vehicle license tax has always been shared with counties and incorporated cities and towns. In the early 1980s, 45 percent of this tax was deposited into the general fund, partly for general purposes and partly for school financial assistance. In addition, 25 percent was distributed to county general funds, 25 percent to incorporated cities and towns’ general funds and an additional 5 percent to county assessors to reimburse them for registration and titling expenses. Currently none is deposited into the general fund. The 45 percent that used to be deposited into Arizona’s general fund is now deposited into the Highway User Revenue Fund. It’s unclear why the revenues of this tax were transferred out of the general fund. The Arizona Constitution requires that all highway-related taxes be earmarked for transportation purposes, specifically gasoline taxes, use fuel taxes (paid primarily on diesel fuel used by trucks in the state), licenses, and weight fees. The motor vehicle license tax, however, is based on the value of the car and, as such, it is a personal property tax and the level of the tax is unrelated to highway usage. In the Arizona Constitution, the motor vehicle license tax is explicitly excluded from the list of highway-related taxes that must be earmarked for transportation. Therefore, the transfer of the revenues from this tax to the Highway User Revenue Fund is an unnecessary erosion of the general fund.
Parimutual Tax
The parimutual tax is imposed on the total amount bet at horse and dog tracks as well as at any simulcast in the state. Rates vary by sport and by the population of the counties where the tracks are located. This tax does not apply to Indian gaming because that is not a parimutual type of activity. The parimutual tax rates were reduced during the mid-90s but the change that most impacted the collections going to the general fund were changes to how the parimutual revenues are distributed. In the early 1980s, 67.5 percent of all parimutual revenues were deposited into the general fund and the remainder were earmarked for a variety of other funds and purposes, with the two largest (receiving 24 percent of revenue) being the Arizona County Fair Racing and Breeders’ Award Fund and the County Fairs Livestock and Agriculture Promotion Fund. In the mid-1990s, the distribution formulas changed so that all parimutual tax revenue were distributed among different racing funds. The exception to this was during the recent fiscal crises. During FY2010, FY2011, and FY2012, parimutual tax revenues were deposited into the general fund. They are not shown as paramutual taxes in the general fund revenue summary because they were short-term fund transfers that were shown under “non-tax” revenues. In FY2013, no parimutual taxes were be deposited into the general fund. Instead all proceeds were distributed to the Racing Regulation Fund.
Luxury Taxes
Luxury taxes represented almost 5 percent of the state general fund revenues in FY1982, but in FY2012 it was below 1 percent. Luxury taxes are imposed on the quantity of tobacco or alcohol consumed. The current luxury tax on cigarettes, for example is $2.00 per pack of 20 cigarettes. The current luxury tax on spiritous liquor (e.g., whiskey) is $3.00 per gallon, on wine with less than 24 percent alcohol content the tax is $0.84 per gallon, and on malt liquor (e.g., beer) the tax is $0.16 per gallon.
There are two reasons why luxury taxes currently represent a small share of the general fund. First, revenues do not keep up with inflation because the taxes are imposed on a per unit basis (e.g., per pack, per gallon), rather than as a percent of sales. In order for this type of tax to keep up with inflation, the tax rates have to be indexed or constantly adjusted. Luxury tax rates have been increased since FY1982, but the increases for most categories have not kept up with inflation. In FY1982, cigarette taxes were $0.13 per pack of 20, spiritous liquor was $2.50 per gallon, wine was $0.42 per gallon and malt liquor was $0.08 per gallon. The percent changes in the tax rates were 1,538 percent for cigarettes, 120 percent for spiritous liquor, 200 percent for wine, and 200 percent for beer. The Consumer Price Index for the Western Region (CPIW) over the same period grew by 240 percent. Therefore, none of the liquor/alcohol-related tax rates have kept up with inflation except for the tax on cigarettes (as well as other tobacco products), which has been dramatically increased. Even though the liquor-related luxury tax rates were not increased enough to keep up with inflation, the revenue erosion associated with this does not begin to explain why luxury taxes currently contribute so little to the general fund.
Again the answer lies in changes to how the revenues from luxury taxes are distributed. Back in FY1982, all luxury tax revenues were deposited into the general fund. Currently, there is an extremely complex distribution formula where luxury tax revenues from tobacco are distributed to the general fund, corrections fund, state school aid, tobacco tax and healthcare fund, and the tobacco products tax fund. In FY2012, of the $319 million collected from the luxury tax on tobacco products, less than $25 million (or 7.8 percent) was deposited into the general fund. The distribution formulas for the luxury tax on liquor products is not quite as complex, but the revenues are distributed among the general fund, state school aid, corrections fund, corrections revolving fund, wine promotional fund, and the drug treatment and educational fund. In FY2012, of the $68 million collected in liquor taxes, just over $34 million (or 50 percent) was deposited into the general fund.
Current Sources of Tax Revenue to General Fund
There are currently three important sources of tax revenues to the general fund — sales and use tax, income tax, and the insurance premium tax. When the temporary 1 percent sales tax is included, the insurance premium tax accounted for 4.7 percent of the general fund in FY2012, income taxes 39.6 percent and sales and use taxes accounted for 54.8 percent. Without the temporary tax, the shares adjust accordingly (Table 1, above).
Insurance Premium Tax
This tax is imposed on the net insurance premiums received by insurance companies. Insurance premiums from all types of insurance are taxed — live, accident, health, dental, fire, vehicle, legal, home and commercial property, medical malpractice, surety and fidelity insurance. The revenues from this tax have grown over time, both as a share of total general fund revenues, from 2.0 percent in FY1982 to 5.3 percent in FY2012 (when the temporary tax is excluded), and in terms of deflated per capita , from $21 in FY1982 to $61 in FY2012 (Figure 3).
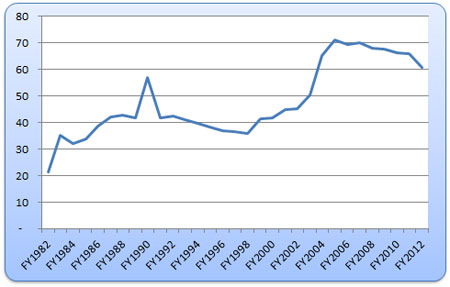
Figure 3: Revenues to the General Fund – Insurance Premium Tax
Deflated per capita $2012
Currently, most of the insurance premium tax is deposited into the general fund. A portion of the tax on fire insurance is transferred to cities and towns and legally organized fire districts. An additional tax paid on insurance carried on vehicles is used to assist the pension plan for highway patrol personnel.
Of the total amount of insurance premium taxes collected in FY2012 ($422 million), 93 percent is deposited into the general fund. Most of this tax has always been deposited into the general fund.
Between FY1982 and FY1990, the basic tax rate doubled from 1 percent to 2 percent, but this is an over-simplification. In FY1982, the state imposed higher rates on insurance carriers that did not maintain home offices in the state. This disparity is no longer there, but the state does retain the ability to impose retaliatory rates on carriers based in states that tax Arizona carriers differentially.
The big swell and decline in insurance premium tax revenues from the late 1990s through FY2012 again corresponded with the boom and bust of the housing bubble. Insurance premium tax revenues did not fall as much as some other revenue sources following FY2007, however. Even if a bank took over ownership of a house or commercial building, insurance on that property still had to be purchased.
Sales and Use Taxes
The term sales and use refers to two different taxes. Sales taxes are imposed on purchases made in Arizona. Use taxes, in contrast, are taxes paid on items purchased outside of Arizona and imported into the state for use. Historically, the use tax has applied mainly to large consumer purchases, e.g., automobiles, boats, and to business purchases, e.g., certain kinds of equipment, furnishings, etc. Since both sales and use taxes are imposed on the basis of sales, they are often combined for presentation.
The sales tax and the use tax are imposed at the same rate. However, if a purchase is made outside of Arizona and the buyer has to pay a sales tax rate elsewhere, Arizona’s use-tax rate for that item is reduced to account for the amount already paid.
For the three years prior to June of this year the state sales tax rate was 6.6 percent, which included the 3-year temporary 1 percent sales tax rate. Currently the state sales tax rate is 5.6 percent. The entire 1 percent temporary tax was deposited in the general fund so the general fund has lost all revenues associated with that tax. Not all revenues collected from the remaining 5.6 percent are deposited into the general fund. The 0.6 percent that was approved by voters (Proposition 301) is designated for public education, health, human services and public safety, so none of it is in the general fund. The remaining 5 percent state sales tax rate is shared with counties and incorporated cities and towns according to complex formulas.
There are approximately 15 categories of sales tax categories in the state. The most familiar ones, representing the largest amounts of taxable sales, are: retail, utilities, telecommunications, publications, printing, transient lodging, personal property s, amusements, and restaurant and bars. A different portion of each of these categories is deposited into the “distribution base,” which is shared. For example, revenues from 2 of the 5 percent tax rate on retailing, personal property rental, amusements and restaurants and bars are put in the distribution base but only 1 of the 5 percent tax rate on the remaining listed categories are available for distribution. All use tax revenues are deposited into the general fund except for 20 percent of the use tax revenue collections from the sale of electricity that are deposited into the distribution base.
Monies in the distribution base are distributed as follows: 25 percent is paid to incorporated cities according to the last census, 40.51 percent is paid to counties according to yet another formula based on county population and the level of sales in the county, and the remaining 34.49 percent is deposited into the general fund. So the general fund receives almost all use tax revenues, 34.49 percent of the distribution base, and all the sales tax revenue not allocated to the distribution base.
In 2012, of the $6,139 million in sales tax collections (not including use tax revenues), $3,652 million (59.5 percent) was distributed to the general fund, cities and counties received $1,028 million (16.7 percent), Proposition 301 collections were $542 million (8.8 percent of all sales tax collections) and the temporary tax collections were $916 million (14.9 percent). The money paid to cities and counties and the Proposition 301 money is not included in general fund money. The temporary tax money is, however, in the general fund. In addition, there are approximately $264 million of use tax collections shown under sales and use tax revenues in the general fund.
In FY1982, the portion of the general fund derived from sales and use taxes was 44.5 percent (Table 1, above). After fluctuating some, the share reached the peak of 55.7 percent in FY2002. In FY2012, 49.2 percent of the general fund was derived from sales and use, excluding the temporary tax. Including the temporary tax, 54.8 percent of the general fund was sales and use tax revenues in FY2012.
Per capita sales and use tax revenues in $2012 are shown in Figure 4. The jump between FY1982 and FY1983 was due to an increase in the overall sales tax rate for the categories listed above from 4 percent to 5 percent, and that increase is evident in the graph. From FY1985 through FY2005, the per capita constant sales and use tax revenues stayed between $630 and $730, averaging $692. Within this period, however, the effect of the 1990/1991 recession is clearly visible.
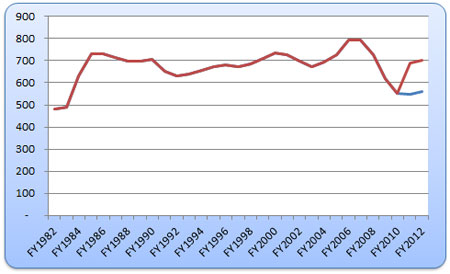
Figure 4: Revenues to the General Fund – Sales and Use Taxes, with and without the 1% Temporary Tax – Deflated per capita $2012
Sales and use tax revenues grew and, like most economic measures in the state, peaked in FY2006 and FY2007 at $793. The decline in sales and use tax revenues was severe, with per capita deflated revenues reaching a low of $550 in FY2011. Excluding the FY1982 figure because it is based on a lower tax rate than existed throughout the rest of the period, the FY2011 revenue figure is by far the lowest and reflects an extremely low per capita $2012 spending on taxable sales. Time will tell how well revenues will respond to growth, but the extreme decline between FY2007 and FY2011 may be due to other causes not fully understood at this time. Numerous factors may have affected that decline, e.g., on-line sales for which use taxes were never paid, loss of wealth associated with the housing crises, consumers paying down debt, the aging of the population, the changing income distribution.
Income Taxes
Income taxes include both the tax on individuals and corporations. The amount deposited into the general fund excludes a portion shared with incorporated cities and towns via the Urban Revenue Sharing formulas. Currently, 15.0 percent of income tax collections (individual and corporations) collected two fiscal years prior to the current one are shared among incorporated cities and towns according to population. There has been some variation over the years in the percentage of income tax collections placed in the Urban Revenue Sharing fund, ranging from 12.8 – 15 percent. Throughout most of the period shown, the percentage was 14.8 or 15 percent, except for the FY1993 – FY1997 period when it was as low as 12.8 percent.
It is clear from looking at Figure 5, however, that the slightly changing percentages deposited in the Urban Revenue Sharing Fund are not the cause of the extreme fluctuations seen in income tax revenues.
The variations in income tax collections can be best explained by examining capital gains, the income in Arizona derived from the appreciation and sale of real or financial assets. Per capita deflated $2012 capital gains from 1986 through 2011 is shown in Figure 6. Two booms and busts are evident in the capital gains series. The first, in the late 1990s, relates to the dot-com boom and, later the bust. This period of time is sometimes referred to as the information technology bubble. It was a time of extreme speculation in internet and technology stocks followed by a collapse in value in 2000-2001. The second “bubble” was fueled by speculation in the housing market and related industries that peaked in late 2007, followed by an 82 percent decline in deflated per capita capital gains between FY2006 and FY2009.
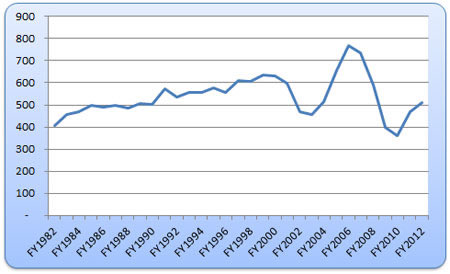
Figure 5: Revenues to the General Fund – Income (Individual and Corporate) Taxes – Deflated per capita $2012
The pattern of income tax collections closely resembles the pattern of capital gains except for the 1990s. In the 1990s, income tax revenues were growing, largely as a result of capital gains, but the pattern does not show the same “bubble” as capital gains. To dampen the growth of government spending, Arizona legislators passed 5 income tax cuts between 1990 and 2000 (1994, 1995, 1997, 1998, and 1999). The result is that the growth of income tax revenues grew at a much slower rate than the growth in capital gains between 1992 and 1999. There were additional tax cuts in 2006 and 2007 to reduce the strong growth in income tax revenues associated with capital gains. These tax cuts were essentially permanent because Arizona requires a 2/3 majority to raise tax rates but only a simple majority to cut them. Unfortunately, the high taxable capital gains were only temporary.
The seven tax cuts since 1990 have permanently reduced the yield of the individual income tax. In FY2010, the per capita deflated income tax revenues were at a 30-year low of $359. Although income tax revenues have started to rise again, it is unlikely that they will ever yield the historical averages of $548 (computed FY1982 – FY2009) without the occurrence of another undesirable bubble.
back to topConclusion
General fund tax sources have changed substantially over the past 30 years. Half a dozen tax revenues sources have either been repealed or have been allocated out of the general fund. Currently only three tax revenue sources make up the bulk of the general fund: sales and use taxes, income taxes and insurance premium taxes. Their shares of the general fund have all increased slightly over time simply due to the removal of approximately 15 percent revenue sources since FY1982.

General fund tax sources have changed substantially over the past 30 years. Half a dozen tax revenues sources have either been repealed or have been allocated out of the general fund…General fund revenues have become more volatile in recent years. Some of that volatility is due to the removal of some stable revenue sources, specifically, statewide property taxes, the motor vehicle license tax, and luxury taxes.
General fund revenues have become more volatile in recent years. Some of that volatility is due to the removal of some stable revenue sources, specifically, statewide property taxes, the motor vehicle license tax, and luxury taxes. Most of the volatility in general fund revenues, however, was due to fluctuations in income tax revenue associated with the booms and busts of capital gains. These fluctuations were more volatile than most other economic measures, so if the US economy can avoid further speculative bubbles, the general fund should follow a more stable growth pattern. Although it will always be vulnerable to recessions, the swings should not be as wide.
References:
[1] History of General Fund Collections – FY1997 through FY2012, from the Arizona Joint Legislative Budget Committee’s website: http://www.azleg.gov/jlbc/historicalgeneralfundrevenuecollections.pdf, accessed August 2013. [2] State of Arizona, 2012 Tax Handbook: http://www.azleg.gov/jlbc/12taxbook/12taxbk.pdf, accessed August 2013. Tax handbooks back to 2002 are available at the JLBC website. Older hard-copy tax handbooks were also used in this article.Photo of business people with tablet and charts courtesy of Shutterstock.


