By George W. Hammond, Ph.D., Director and Research Professor, EBRC
Note from the editor: We are featuring a picture of a cat in a moving box today just for a smile. Although we’re all Arizona Wildcats here, Arizona’s Economy does not wish to show favoritism to cats over dogs. Our team has both cat and dog owners. In my experience traveling across country with a cat is pretty bad, but dogs have a good time. What do you think?
The pandemic has generated speculation that Arizona might experience a surge of new migrants from other states, particularly if remote workers begin to flee high-cost metropolitan areas in large numbers.
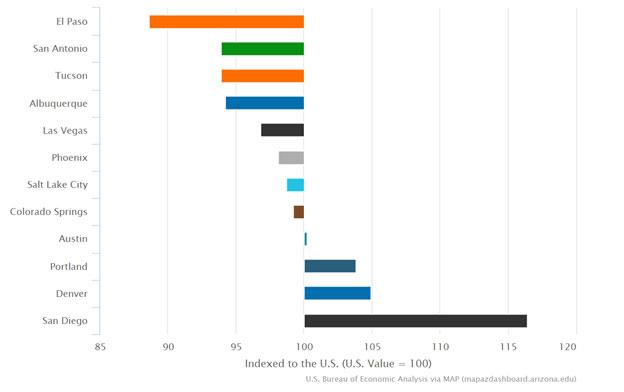
Data on Arizona’s cost of living suggests that the state does have an advantage in this respect. Data from EBRC’s MAP Dashboard shows how the cost of living (according to estimates from the U.S. Bureau of Economic Analysis for 2018) in Tucson and Phoenix stacks up against peer western metropolitan areas (Exhibit 1).
As the exhibit shows, Tucson’s cost of living was 93.9 percent of the national average (of 100.0). In other words, Tucson was 6.1% below the U.S. Phoenix was also below the national average at 98.1. Note that Portland, Denver, and San Diego were well above the U.S. For reference, the cost of living in Los Angeles was 17.1% above the nation. San Francisco was 31.6% above the U.S. and Seattle was 12.9% higher than the nation.
Exhibit 1: The Cost of Living in Phoenix and Tucson Was Below the Nation in 2018
If Arizona does experience a surge in in-migration, it is likely to come from states that already have an established pattern of sending people to the state. That makes it a good time to review the latest Census data on migration flows into Arizona.
Exhibit 2 shows the top 10 states contributing migrants to Arizona, Phoenix, and Tucson. These are five-year estimates (2014-2018) from the Census American Community Survey PUMS and represent one-year gross population flows into Arizona. These are not net flows.
As the exhibit shows, California contributed by far the most migrants to Arizona, Phoenix, and Tucson during the period. Texas and Washington rounded out the top three contributing states for each region.
Exhibit 2: California Contributed by Far the Most Migrants to Arizona, ACS Five-Year Estimates (2014-2018), Annual Gross Migration Flows Into Region by State of Residence One Year Ago
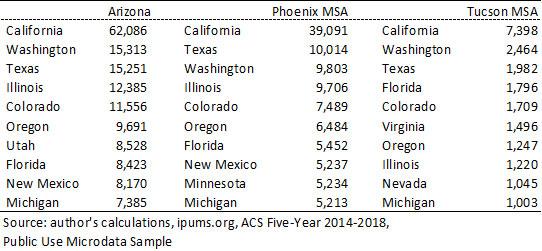
Exhibit 3 shows gross domestic migration to Arizona, Phoenix, and Tucson by U.S. Census Region. As the exhibit shows, the majority of migrants to Arizona come from the West, followed by the South and Midwest (in about equal amounts). Arizona drew the fewest migrants from the Northeast during the period. In total, the state drew 264,870 migrants from other states annually (on average) during the period.
Exhibit 3: Annual Gross Migration Flows Into Region by U.S. Census Region of Residence One Year Ago, ACS PUMS Five-Year Estimates, 2014-2018
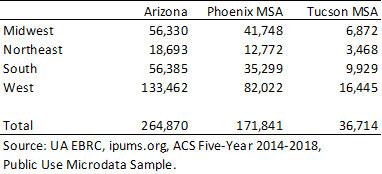
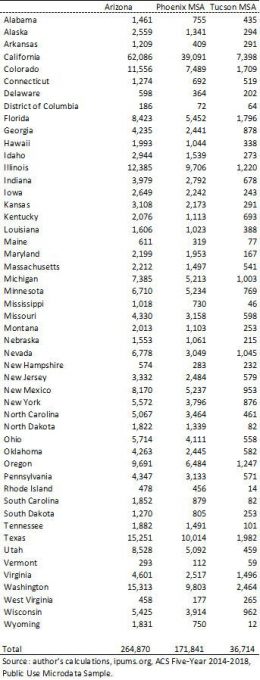
Exhibit 4 shows gross domestic migration flows into Arizona, Phoenix, and Tucson by state. Arizona drew the most migrants from California and the fewest from the District of Columbia and Vermont.
Exhibit 4: Annual Gross Migration Flows Into Region by State of Residence One Year Ago, ACS PUMS Five-Year Estimates, 2014-2018