By George W. Hammond, Ph.D., Director and Research Professor, EBRC
The COVID-19 pandemic has produced a major shock to global, national, state, and local labor markets. Economists, striving to keep up with rapidly unfolding events, have focused on high-frequency data like weekly initial and continuing claims for unemployment insurance, as well as more traditional monthly indicators like nonfarm payroll jobs and the unemployment rate.
Given the importance of these indicators, it is worth a few minutes to consider what the data tells us and what it does not.
Unemployment Insurance
Let’s start with a brief sketch of the data coming from the unemployment insurance system. The regular unemployment insurance system is state run and employer financed. It is designed to temporarily stabilize the income of workers who lose their jobs through no fault of their own. Not all jobs are covered by unemployment insurance. For instance, the regular system excludes the self-employed and gig workers.
The most often cited weekly data that arises from the unemployment insurance system are initial and continuing claims. An initial claim is a request for determination of basic eligibility. A continuing claim follows an initial claim. These data are highly correlated with, but not exactly equal to, individuals receiving benefits. Some claims are denied but we do not have data from the Arizona Department of Employment of Security on the number of claims denied each week.
For most states, Arizona included, unemployment insurance coverage provides a maximum of 26 weeks of benefits to eligible claimants. The maximum benefit in Arizona is relatively low, compared to other states, at $240 per week. Only Mississippi has a lower maximum weekly benefit. Unemployment benefits are subject to income tax.
These data arise from a noisy administrative dataset. They are not produced in order to provide evidence regarding economic trends. Nonetheless, economists have long used initial and continuing claims as economic indicators. Initial claims are considered a reliable leading indicator, in part because they tend to rocket upward when the economy is just starting to slow. They tend to provide a very decisive signal that increased numbers of individuals are losing their jobs. They tell us nothing about offsetting flows into employment.
The CARES Act provided for significant additions to the regular unemployment insurance program. These additions are outlined below:
- Extended regular unemployment insurance coverage by 13 weeks
- Created Pandemic Unemployment Assistance (PUA)
- Provides coverage to self-employed, gig workers, and other who do not qualify for the regular state program
- Federal payment of regular benefit for additional 13 weeks
- Set to expire at the end of December 2020
- Created Federal Pandemic Unemployment Compensation (FPUC)
- $600/week supplement to regular state benefit for both regular and PUA recipients
- Expired at the end of July 2020
The current federal administration, via Executive Order, created the Lost Wages Supplemental Payment Assistance program. It diverted funds from FEMA to provide a weekly supplement of $300 per week. This expired in early September.
Initial claims for PUA have surged since the data began to be reported separately from the regular claims (May 15). They plummeted in early August as the Arizona Department of Employment Security increased fraud prevention measures. PUA claims surged again in early September. These claims are likely to be subject to increased fraud because they are more difficult to verify. In contrast to regular claims, there is no employer to verify employment and wages to the Arizona Department of Employment Security.
In addition, individuals have likely been applying simultaneously for both the regular and PUA benefits. As a result, both regular and PUA initial claims are more difficult to interpret as an economic indicator currently.
Finally, initial and continuing claims for unemployment insurance have no connection to the national unemployment rate measured via the Current Population Survey. There is a modest connection between the claims data and state unemployment rates.
Nonfarm Payroll Jobs
The count of nonfarm payroll jobs by industry originates from a survey of establishments known as the Current Employment Statistics program (CES). The survey counts jobs on the payrolls of establishments during the pay period including the 12th of the month. The data are released each month, with prior month revisions, and once each year (in March) the prior 18 months are revised.
The annual benchmark revision adjusts the level of the CES to more closely match that of the Quarterly Census of Employment and Wages (QCEW). In turn, the QCEW data provide a count of establishments, jobs, and wages of firms that provide unemployment insurance coverage to employees. The QCEW data is a very high-quality dataset, but is only available with a six month lag.
Both the QCEW and CES data count the number of jobs and associated wages. Each excludes the self-employed and most agricultural workers. Since these datasets count jobs, a person with two jobs is counted twice.
Labor Force and Unemployment Rate
Data on the labor force and the unemployment rate come from a survey of households known as the Current Population Survey. On behalf of the Bureau of Labor Statistics, the Census Bureau contacts households each month during the week including the 12th to inquire about their labor market activities.
The survey provides data on the labor force, employment, unemployment, as well as many other indicators of labor market performance. In May, EBRC’s Valorie Rice prepared a great summary of the characteristics of the core data available from the CPS.
It is important to remember that the headline unemployment rate, which is often referred to as the “official” or U-3 rate, depends on a very specific definition of what it means to be unemployed. An unemployed person under the U-3 definition was not employed during the reference week, was willing to work and available to work during that week, and actively sought employment during the prior four weeks or was on temporary layoff and expecting to be recalled to a job. Receipt of unemployment insurance benefits has no impact on this determination.
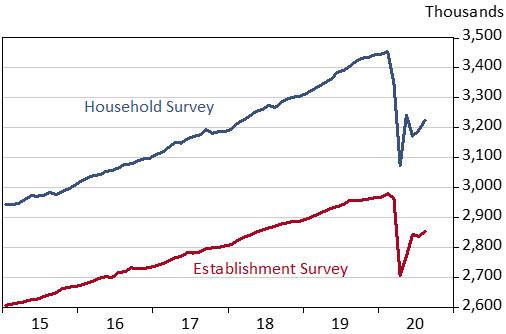
The labor force is defined as the sum of employment and unemployment. The unemployment rate is the ratio of unemployment to the labor force. The official measure excludes the military but includes the self-employed, agricultural workers, and unpaid family workers. For this reason, employment measured by the household survey tends to be larger than the count of jobs from the establishment survey. Nonetheless, the two series are highly correlated (Exhibit 1).
Exhibit 1: Arizona Employment Measured by the Household and Establishment Surveys, Seasonally Adjusted
If a person does not have a job and does not meet the criteria to be classified as unemployed then that person is not counted in the labor force. This can create counter-intuitive movements in the official unemployment rate. If an unemployed person stopped their job search activities during the prior month, perhaps because the situation seemed hopeless, then they fell out of the count of the unemployed, and the unemployment rate declined, other things the same.
To provide additional perspectives on the labor market, the Bureau of Labor Statistics also publishes alternative measures of unemployment. Some of these measures narrow the official definition and some expand it.
Two measures that narrow the definition of unemployment are U-1 and U-2. The U-1 definition includes persons unemployed 15 weeks or longer, as a percent of the civilian workforce. The U-2 definition includes job losers and persons who completed temporary jobs, as a percent of the civilian labor force.
There are three measures that expand the concept of unemployment. The U-4 measure includes everyone included in the U-3 measure, plus discouraged workers, as a percent of the civilian labor force plus discouraged workers. Discouraged workers are persons who are not in the labor force (U-3 definition), want and are available for work, and had looked for a job sometime in the prior 12 months. They had not looked for work in the prior four weeks for the specific reason that they believed no jobs were available for them.
The U-5 measure includes the U-3 unemployed, plus discouraged workers, plus all other marginally attached workers, as a percent of the civilian labor force plus all marginally attached workers.
The marginally attached are a group that includes discouraged workers. The criteria for the marginally attached are the same as for discouraged workers, with the exception that any reason could have been cited for the lack of job search in the prior four weeks.
Finally, the U-6 measure includes the U-3 total unemployed, plus all marginally attached workers, plus total employed part time for economic reasons, as a percent of the civilian labor force plus all marginally attached workers.
Persons employed part time for economic reasons (U-6 measure) are those working less than 35 hours per week who want to work full time, are available to do so, and gave an economic reason (their hours had been cut back or they were unable to find a full-time job) for working part time.
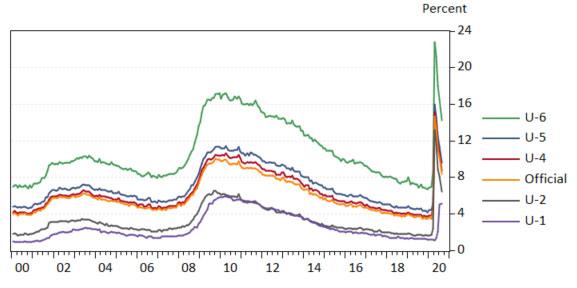
As Exhibit 2 shows for the U.S., unemployment rates generally tend to rise as the definition of unemployment becomes more expansive. In addition, while the levels of these measures differ significantly, they tend to be highly correlated over time.
Exhibit 2: U.S. Unemployment Rates, Official and Alternative Measures, Seasonally Adjusted
Versions of these alternative measures of unemployment are available for states from the Bureau of Labor Statistics. These data are available on a rolling-four-quarter basis, with the most up-to-date data for the second quarter of 2020 (as of this writing). The official unemployment rate results may differ from the published estimates available through the Local Area Unemployment Statistics (LAUS) program.
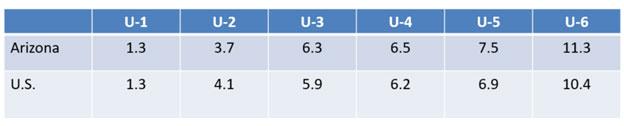
As Exhibit 3 shows, the four-quarter moving average U-3 rate for Arizona was 6.3% in the second quarter of 2020. That was above the national estimate of 5.9%. For the U-6 measure, Arizona’s rate was 11.3% compared to 10.4% for the U.S.
Exhibit 3: Alternative Measures of the Arizona and U.S. Unemployment Rate, Four-Quarter Average in Percent, Second Quarter 2020