
Valorie Rice, Senior Business Information Specialist
Current data releases as of 20 November 2020
Arizona was one of the few states to have its unemployment rate rise between September and October. Only eight states had a rise in jobless rates while 37 states lowered and five were unchanged according to the November 20 Bureau of Labor Statistics release for State Employment and Unemployment. At 8.0 percent, Arizona’s unemployment rate increased by 1.5 percentage points over-the-month while Kentucky increased 1.8 percentage points, making it the state with the highest increase. The state with the largest unemployment rate decrease in October was Illinois (-3.6 percentage points). The states with the highest and lowest unemployment rates in September were also at both ends of the spectrum for October at 14.3 percent in Hawaii and 3.0 percent in Nebraska.
October Arizona nonfarm employment was down 2.5 percent compared the same period last year before seasonal adjustment according to the Arizona Office of Economic Opportunity November 19 release. Trade, transportation and utilities posted over the year gains in employment along with other services. All other sectors have fewer jobs than this time last year, particularly leisure and hospitality, which is down 14.6 percent. Year-over-year employment changes for Arizona metropolitan areas in order of degree, Sierra Vista 0.9 percent, Prescott -0.3 percent, Phoenix -2.4 percent, Lake Havasu City-Kingman -2.8 percent, Tucson -3.4 percent, Yuma -4.2 percent, and -16.6 percent in Flagstaff. Arizona’s seasonally adjusted unemployment rate increased to 8.0 percent in October compared to 6.5 percent in September.
Use your cursor as a tooltip to view values on the chart and click titles on/off in the legend at the bottom of the chart to make comparisons.
Total personal income increased for all Arizona counties in 2019, ranging from an increase of 0.7 percent in Coconino County to 5.4 percent in La Paz. The Bureau of Economic Analysis releases annual personal income data for counties and metropolitan areas every November. Per capita income in 2019 was highest in Maricopa County at $49,704 while the county with the lowest per capita income was Graham with $31,895. Coconino and Pima counties ranked second and third in the state for per capita income with $49,189 and $45,456, respectively. Coconino County, which is Flagstaff metropolitan area, had the largest metropolitan area per capita income in Arizona followed by Phoenix-Mesa-Chandler at $48,065 (Maricopa and Pinal counties combined), Tucson (Pima County) at $45,456, Sierra Vista-Douglas (Cochise County) at $41,766, Prescott Valley-Prescott (Yavapai County) at $41,393, Yuma (Yuma County) at $36,570, and Lake Havasu City-Kingman (Mohave County) at $34,393.
Housing affordability decreased in nearly all Arizona metropolitan areas during the third quarter 2020 compared to the second quarter 2020. Rising home prices pushed U.S. housing affordability to the lowest level in two years according to the November 5 National Association of Home Builders/Wells Fargo Housing Opportunity Index release. Nationally, 58.3 percent of new and existing homes bought in the third quarter were affordable for families earning the U.S. median income of $72,900 as the national median home price rose to an all-time high of $313,000 due to shortages in inventory. In Arizona, Flagstaff and Prescott had a lower share of homes affordable for their area median family incomes compared to the U.S. with 48.0 percent and 46.3 percent, respectively. The shares for other Arizona metropolitan areas were Sierra Vista-Douglas 88.0 percent, Yuma 74.8 percent, Tucson 69.7 percent, Phoenix-Mesa-Scottsdale 61.9 percent, and Lake Havasu City-Kingman 60.2 percent. Only Flagstaff had a slightly higher share of homes affordable in the third quarter versus the second and data for Yuma were not available for the second quarter so not comparison was available.
There were 1,019 Arizona bankruptcy filings in October, 31.9 percent fewer than the same month a year ago. Bankruptcies have decreased every month so far in 2020 with year-to-date filings down 20.2 percent for the state, -19.3 percent for the Phoenix office, -25.1 percent for the Tucson office, and -9.7 percent for the Yuma office. The Phoenix office includes Apache, Coconino, Gila, Maricopa, Navajo, and Yavapai counties. The Tucson office handles Cochise, Graham, Greenlee, Pima, Pinal, and Santa Cruz counties, while the Yuma office represents La Paz, Mohave, and Yuma counties. Chapter 13 (individual debt adjustment) is down 37.1 percent in Arizona year-to-date.
Use your cursor as a tooltip to view values on the chart and click titles on/off in the legend at the bottom of the chart to make comparisons.
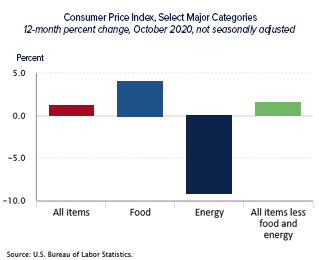
The Consumer Price Index was unchanged in October. Component indexes were mixed and mostly offset each other according to the November 12 Bureau of Labor Statistics release. The seasonally adjusted index for all items less food and energy also did not move over the month. Over the year changes before seasonal adjustment, however point to increases in food and other items while energy has decreased. The annual inflation rate for October was 1.2 percent before seasonal adjustment.
Outdoor recreation value added as a percent of Arizona’s state GDP was 2.6 percent in 2019 and accounted for 2.8 percent of jobs in the state. The outdoor recreation economy accounted for 2.1 percent of current-dollar GDP for the U.S. for 2019 according to a November 10 Bureau of Economic Analysis release. Arizona was among the top twenty states for outdoor recreation value added as a share of state GDP, which ranged from 5.8 percent in Hawaii to 1.3 percent in Connecticut. The release places outdoor recreation into three general categories: conventional activities (such as bicycling, hiking, boating/fishing, and RVing); other core activities (gardening and outdoor concerts); and supporting activities (travel and tourism, local trips, government expenditures, and construction).
U.S. nonfarm payroll employment increased by 638,000 jobs in October. Both August and September employment figures were revised upward for a combined 15,000 more jobs than previously reported according to the November 6 Bureau of Labor Statistics release. Monthly job gains were most prominent in leisure and hospitality, professional and business services, and retail trade. The October seasonal adjusted unemployment rate dropped to 6.9 percent from 7.9 percent in September. The employment-population ratio increased to 57.4 percent for the month.
The U.S. trade deficit lowered in September after increasing for July and August. It stood at $63.9 billion for the month compared to a revised August figure of $67.0 billion. September exports increased $4.4 billion to $176.4 billion with exports of goods increasing $3.7 billion and exports of services increasing $0.7 billion. Imports increased by $1.2 billion over-the-month to $240.2 billion. The year-to-date deficit of goods and services was 8.6 percent higher than the same period in 2019 according to the November 4 joint release from the U.S. Census Bureau and the U.S. Bureau of Economic Analysis.