
Valorie Rice, Sr. Business Information Specialist
Current data releases as of 14 January 2022
In 2021, Arizona went an entire year with less than 1,000 bankruptcy filings per month. That has not happened since 2007 when a change in bankruptcy law caused an abnormally high number of filings in the months leading up to October 2005 and very small number in the proceeding months, lasting through 2006 and 2007. There were 590 bankruptcies in December 2021, far fewer than the average for the month. Bankruptcies in the state were down 27.5 percent in 2021, totaling 9,353 compared to 12,903 in 2020 and 16,237 in 2019. The Phoenix office was down 29.0 percent, the Tucson office down 23.7 percent and the Yuma office down 22.7 percent for the year. La Paz was the only county to have an increase in filings for the year with 17 compared to 13 in 2020. Apache had the largest percent decrease at 50.0 percent while Maricopa had the largest numerical decrease in filings. The Phoenix office includes Apache, Coconino, Gila, Maricopa, Navajo, and Yavapai counties. The Tucson office handles Cochise, Graham, Greenlee, Pima, Pinal, and Santa Cruz counties, while the Yuma office represents La Paz, Mohave, and Yuma counties.
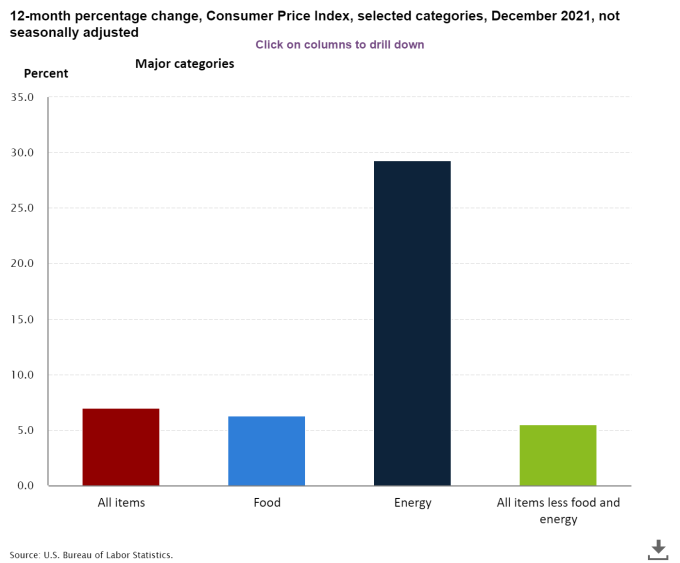
The annual inflation rate for December was 7.0 percent, the largest 12-month increase in the index since June 1982. Energy prices rose 29.3 percent over the last year while food increased 6.3 percent. The monthly Consumer Price Index increased 0.5 percent in December on a seasonally adjusted basis according to the January 12 Bureau of Labor Statistics release. The food index increased 0.5 percent in December, a bit lower than previous months. Used cars and trucks and shelter were the largest contributors to the overall index for the month. The index for all items less food and energy increased 0.6 percent in December.
Pinal County population grew the most in 2021 with a 2.5 percent gain. The July 1, 2021 population estimates from the Arizona Office of Economic Opportunity released in mid-December indicated that the state population grew 1.5 percent for the year. The counties with the most population gain over the year were Pinal (2.5 percent), Yavapai (1.7 percent), and Maricopa (1.6 percent). The counties with the smallest amount of population change were Greenlee (0.3 percent), Gila (0.4 percent), and Apache (0.5 percent). Queen Creek, which is in both Maricopa and Pinal counties, was the fastest-growing city in the state between 2020 and 2021 with 9.0 percent growth. Pinal is home to several of the fastest-growing cities in the state, such as Coolidge (7.1 percent) and Eloy (5.3 percent), also contains the town with the largest drop in people, as Florence population declined 6.2 percent.
Arizona was among the fastest growing states in the nation for 2021. The U.S. Census Bureau released 2021 population estimates for states at the end of December and the report indicated the nation posted the slowest growth on record with the population of the U.S. adding just 0.1 percent between 2020 and 2021. Idaho was the state with the largest percent change in population at 2.9 percent followed by Utah (1.7 percent), Montana (1.7 percent), Arizona (1.4 percent), and South Carolina (1.2 percent). States with the largest change in number of residents were Texas, Florida, Arizona, North Carolina, and Georgia. New York and the District of Columbia were notable for population decline with losses of 1.6 percent and 2.9 percent, respectively. The estimates include resident population age 18 and over. We can invert this to find out which states have the largest percent of under 18 population. The youngest state was Utah with 28.4 percent of its population being under age 18 while Vermont was the state with the least percent of children at 18.1 percent. Arizona was equal to the U.S. as both had 22.2 percent of the population under age 18.
Real Personal Consumption Expenditures and Personal Income by State for 2020 released on December 15 by the Bureau of Economic Analysis indicated that Arizona’s real personal income increased 8.4 percent. This placed it among the states with the highest increase. The report provides current-dollar personal income adjusted by the state’s regional price parity and the national personal consumption expenditures price index. Real state personal income increased 5.3 percent for the nation in 2020. The change in real personal income for states ranged from 9.8 percent in Idaho down to 1.6 percent in Alaska. This was the first official release of real state personal consumption expenditures (PCE). Real PCE decreased 3.8 percent in the U.S. after increasing 2.2 percent in 2019. Change in real PCE for 2020 ranged from 2.2 percent in Utah to -7.0 percent in Hawaii, Maryland, and New York. Only three states, Utah, Idaho, and Montana posted positive changes in consumption expenditures. Arizona’s real PCE decreased 2.0 percent for 2020.
Real gross domestic product (GDP) decreased for most counties in the nation during 2020, though a handful were steady and a little more than a quarter of counties had increases. The change in real GDP by county was wide ranging, going from 91.0 percent in Foard County, TX to -29.0 percent in Skagway Municipality, AK. Arizona counties ranged from 5.2 percent in Cochise County to -7.4 percent in Coconino County.
U.S. employment increased by 199,000 nonfarm payroll jobs in December on a seasonally adjusted basis. Job growth averaged 537,000 per month for the year. Leisure and hospitality, professional and business services, manufacturing, construction, and transportation and warehousing all had continued increases in December. The unemployment rate for the U.S. was 3.9 percent for December based on the Bureau of Labor Statistics January 7 Employment Situation release.
The U.S. trade deficit jumped back up in November moving to $80.2 billion from a revised October figure of $67.2 billion after reaching $81.4 billion in September. Imports grew $13.4 billion over the month to $304.4 billion for November. Exports were $224.2 billion, an increase of $0.4 billion. The goods deficit was $99.0 billion in November while the services surplus increased to $18.8 billion. The deficit of goods and services year-to-date was 28.6 percent higher than the same period in 2020 according to the joint Census Bureau and Bureau of Economic Analysis January 6 release.