
EBRC Research Staff
Current data releases as of 16 February 2024
A little more than half of the homes sold in Sierra Vista-Douglas during the fourth quarter of 2023 were affordable to a family earning the median income. At 54.3%, that was the highest affordability rank in the state for the fourth quarter. Nationally, 37.7% of new and existing homes were affordable for those with the U.S. median family income, roughly the same share as in the third quarter, which was 37.4%, according to the National Association of Home Builders/Wells Fargo Housing Opportunity Index. Sierra Vista-Douglas and Yuma were the only Arizona metropolitan areas with higher housing affordability than the nation. Phoenix sank to the bottom of the Arizona list in the fourth quarter of 2023 with just 21.7% of affordable homes, replacing Prescott Valley-Prescott. Prescott Valley-Prescott and Yuma improved affordability between the third quarter and the fourth. The most affordable markets in the United States for the fourth quarter of 2023 were in Michigan, with Bay City, MI topping the list at 88.3%. The bottom for affordability lies squarely in California, which claimed the lowest eleven metropolitan areas, each with single-digit shares, the last being Los Angeles-Long Beach-Glendale, CA, at 2.7%. –Valorie Rice
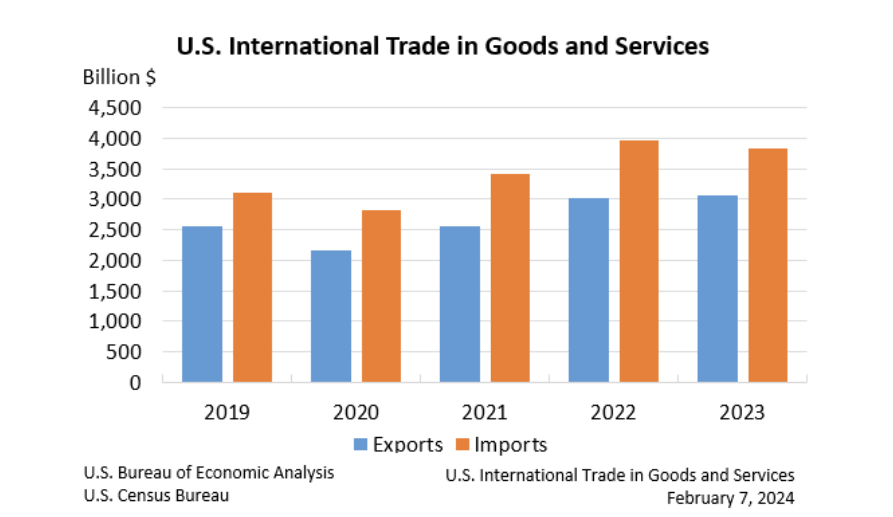
The December goods and services trade deficit came in at $62.2 billion, up $0.3 billion from a revised $61.9 billion in November. December exports rose $3.9 billion from November to $258.2 billion, and imports similarly rose $4.2 billion to $320.4 billion. The increase in the deficit reflects an increase in the goods deficit of $0.7 billion to $89.1 billion and an increase in the service surplus of $0.4 billion to $26.9 billion. For 2023, the goods and services deficit was $773.4 billion, down $177.8 billion from $951.2 billion in 2022. Exports were up $35.0 billion to $3053.5 billion, and imports were down $142.7 billion to $3826.9 billion. The real goods deficit decreased $90.1 billion, or 8.0%, to $1,035.1 billion in 2023, compared with a 9.6% decrease in the nominal deficit. The greatest surpluses in 2023 were with South and Central America ($54.9), Netherlands ($43.7), and Hong Kong ($23.6), while China ($279.4), European Union ($208.2), and Mexico ($152.4) showed the greatest deficits (in billions). – Delaney O’Kray-Murphy
In December, over the year metropolitan unemployment rates were higher in 230 of the 389 metropolitan areas, lower in 128, and unchanged in the remaining 31. The December unemployment rate for the Tucson and Phoenix metropolitan areas came in at 3.6% and 3.4%, respectively. Yuma had the highest unemployment rate in Arizona at 12.9%, while Prescott had the lowest at 3.3%. Burlington-South Burlington, VT, had the lowest unemployment rate in the nation at 1.6%, and El Centro, CA had the highest rate of unemployment at 18.3%. The largest over-the-year increase occurred in El Centro, CA (+3.1 percentage points), and Grants Pass, OR, had the largest over-the-year decrease (-1.6 percentage points). – Delaney O’Kray-Murphy
According to the U.S. Bureau of Labor Statistics, the Consumer Price Index for All Urban Consumers (CPI-U) experienced a 0.3% increase in January on a seasonally adjusted basis, following a 0.2% rise in December. In January, the index for shelter continued its upward trend, contributing over two-thirds of the monthly all-items increase with a rise of 0.6%. The food index also had a 0.4% increase, with prices for both food at home and food away from home rising. Conversely, the energy index fell by 0.9%, primarily due to a decline in gasoline prices. The index for all items less food and energy rose by 0.4% in January. Increases were also observed in various sectors, including shelter, motor vehicle insurance, and medical care, while decreases were noted in used cars and trucks, as well as apparel. On an annual basis, the all-items index had a 3.1% increase for the 12 months ending January, slightly lower than the 3.4% increase recorded for the 12 months ending December. Meanwhile, all items less food and energy index maintained a 3.9% increase over both periods. Energy prices decreased by 4.6% over the 12 months ending January, while the food index saw a 2.6% increase over the past year. --Prarthana Magon
Use your cursor as a tooltip to switch series ON/OFF at the bottom of the chart. Run your cursor over the chart to view values.
The Producer Price Index (PPI) for final demand increased by 0.3% in January, following a 0.1% decline in December 2023. In the 12 months ending January 2024, the PPI index rose by 0.9% (unadjusted). The January final demand index rise was led by a 0.6% increase in final demand services prices, marking the largest increase since rising 0.8% in July 2023. Within final demand services, the January increase was largely driven by higher prices for services excluding trade, transportation, and warehousing, which climbed by 0.8%. More specifically, a 2.2-percent increase in the index for hospital outpatient care significantly contributed to the January rise in prices for final-demand services. In the same period, the index for final demand goods fell by 0.2%, a fourth consecutive decline. Final demand goods prices were impacted by a 1.7% decline in final demand energy prices, particularly driven by a 3.6% decline in gasoline prices. The index for final demand, excluding foods, energy, and trade services, had a notable 0.6% increase, marking its largest rise since January 2023, with a 2.6% increase over the year. --Prarthana Magon
According to the February 14th State Job Openings and Labor Turnover (JOLTS) report, job openings rates decreased in four states, increased in three states, and changed little in all other states. The job openings rate for Arizona was 4.9% in December, 5.5% in November, and 5.5% in October. The number of job openings decreased in seven states and increased in four states, while all other states had relatively little or no change. The states with the largest decrease in the number of job openings were Illinois (-42,000), Arizona (-21,000), and Wisconsin (-20,000). Hire rates decreased in one state, increased in two states, and had little change in all other states. The largest increase was Nevada with +0.9%, followed by California at +0.5%. Hire rates for Arizona were 4.2% for December, 3.6% for November, and 4.4% for October. The number of hires decreased in one state, increased in four states, and changed little in all others. California (+81,000) and Arizona (+20,000) experienced the largest increases in hire levels. The number of layoffs and discharges increased in four states and was little changed in all other states. The largest increase was seen in Illinois (+21,000) and Maryland (+20,000). Nationally, the layoffs and discharges rates and total separations rates were little changed. --Alex Jaeger
The U.S. Census Bureau recently released new data on non-employer businesses by demographic characteristics. In 2020, 36.7% of U.S. businesses without paid employees were minority-owned. Women owned 41.1% of non-employer businesses in the nation in 2020, while the figure was a bit higher in Arizona at 42.3%. Arizona also had a larger percentage of Hispanic-owned and veteran-owned firms, with 23.1% of Arizona businesses without paid employees being Hispanic-owned versus 16.4% nationally. Veteran-owned firms represented 6.1% in Arizona and 4.8% in the U.S. --Valorie Rice
Total farmland and the number of farms in Arizona declined over the last ten years even though the average size of farms has grown. The same can be said nationally based on recently released 2022 Census of Agriculture reports. Look for an article detailing information on Arizona farms, farm production, and characteristics of farm operators coming up in the next two months as further agricultural census information becomes available from the U.S. Department of Agriculture. --Valorie Rice