
EBRC Research Staff
Current data releases as of 10 May 2024
Nationally, public school spending per pupil increased to $15,633 in fiscal year 2022. This was a change of 8.9%, the largest increase in over 20 years. Arizona per-pupil public school spending increased 7.3% during the same period, following a 9.4% increase for the state in fiscal year 2021. Despite recent growth, Arizona’s public school spending was still among the lowest in the nation. The states spending the least per pupil in FY 2022 were Utah ($9,552), Idaho ($9,670), Arizona ($10,315), Oklahoma ($10,890), and Mississippi ($10,984). States in the Northeast region were among those spending the most per pupil, with New York at the top with $29,873. Along with being towards the bottom of states for total public school spending per pupil, Arizona ranked last for total instruction spending, which includes salaries, benefits, supplies, materials, and contractual services. Arizona also ranked last for school administration spending. The U.S. Census Bureau provides an interactive visualization of the most recent ten years of school finances based on the Annual Survey of School System Finances. –Valorie Rice
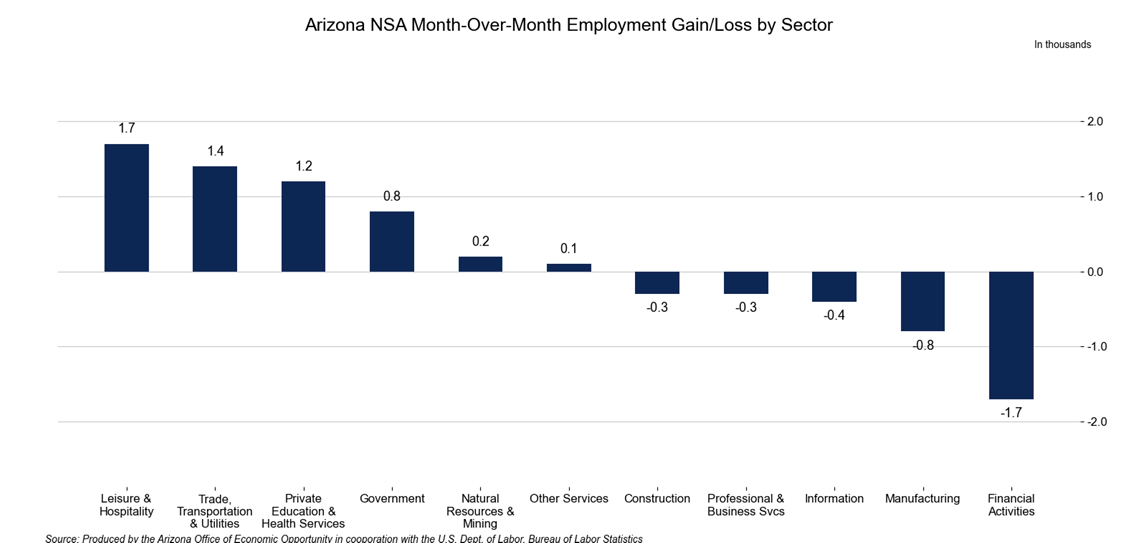
Total nonfarm employment in Arizona increased by 69,600 over the year in March, with the non-seasonally adjusted unemployment rate decreasing 0.6 percentage points to 2.9%. The seasonally adjusted unemployment rate decreased 0.3 percentage points over the month to 3.8%. In comparison, the U.S. seasonally adjusted unemployment rate decreased by 0.1 percentage points over the month to 3.8%, and the non-seasonally adjusted unemployment rate increased by 0.3 percentage points over the year. Arizona unadjusted total nonfarm employment increased by 1,900 jobs in March, lower than the pre-pandemic average of 10,800. Employment gains were reported in leisure & hospitality (1,700); trade, transportation & utilities (1,400); private education & health services (1,200); government (800); natural resources & mining (200); and other services (100). Employment losses occurred in financial activities (-1,700), manufacturing (-800), information (-400), construction (-300), and professional & business services (-300). –Delaney O’Kray-Murphy
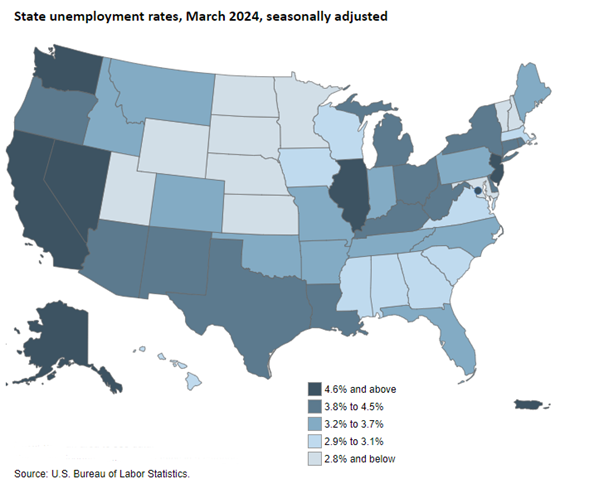
Unemployment rates remained stable in most states for March, though Arizona was an exception. Of the six states with decreased seasonally adjusted monthly unemployment rates, Arizona experienced the biggest change, with a 0.3 percentage point drop to 3.8%. Florida had the only rate increase. The lowest jobless rate in the nation for March was in North Dakota, with 2.0%, while California posted the highest at 5.3%. According to the U.S. Bureau of Labor Statistics release, 23 states had unemployment rates lower than the U.S. seasonally adjusted figure of 3.8%. Arizona’s rate was the same as the nation’s in March. Nonfarm payroll employment increased in five states between February and March (Virginia, Georgia, Kentucky, Arkansas, and Kansas). The rest of the states were essentially unchanged for the month. –Valorie Rice
A little more than half of the metropolitan areas in the nation had unemployment rates lower than the U.S. non-seasonally adjusted rate of 3.9%. This included most of the metropolitan areas within Arizona. The lowest jobless rate was in Burlington-South Burlington, VT, which posted a rate of 1.6% based on the U.S. Bureau of Labor Statistics May 1 release. El Centro, CA, which perennially reports the highest metropolitan area unemployment rate, continued its pace at 16.1% for March. The lowest unemployment rate in Arizona was Phoenix at 2.6%, followed by Prescott at 2.7%, Tucson at 2.8%, Flagstaff at 3.0%, Sierra Vista-Douglas at 3.4%, Lake Havasu City-Kingman at 3.6%, and Yuma at 8.5%. Yuma had the largest over-the-year drop in jobless rates, moving down 1.2 percentage points between March 2023 and March 2024. Note that the metropolitan unemployment rates are reported as not seasonally adjusted. Monthly nonfarm payroll employment in March was basically unchanged in most metropolitan areas. –Valorie Rice
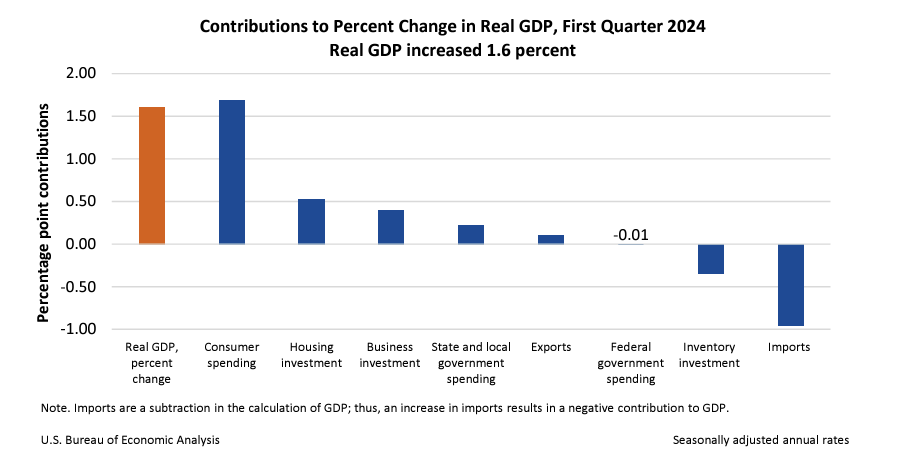
According to the advanced estimate released by the U.S. Bureau of Economic Analysis, U.S. real gross domestic product increased at an annual rate of 1.6% in the first quarter of 2024. The increase reflects increases in consumer spending and housing investment that were partially offset by a decrease in inventory investments. Imports, which negatively affect GDP, increased. The increase in consumer spending reflected an increase in services and a decrease in goods. Health care, financial services, and insurance led to the increase in services, while motor vehicles and parts and gasoline and other energy goods decreased the most within goods. The increase in housing investment was led by new single-family housing construction along with brokers’ commissions and other ownership transfer costs, while the decrease in inventory investment was led by a reduction in wholesale trading and manufacturing. –Delaney O’Kray-Murphy
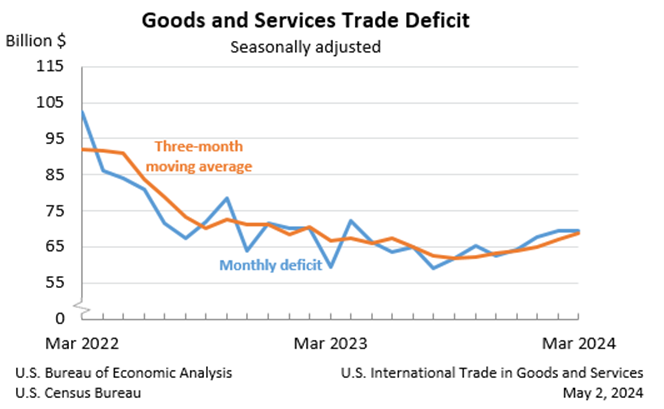
The March goods and services trade deficit came in at $69.4 billion, down $0.1 billion from a revised $69.5 billion in February. March exports decreased $5.3 billion from February to $257.6 billion, and imports similarly decreased $5.4 billion to $327.0 billion. The decrease in the deficit reflects an increase in the goods deficit of $0.8 billion to $92.5 billion and an increase in the services surplus of $0.9 billion to $23.1 billion. The real goods deficit increased $1.3 billion, or 1.4%, to $88.6 billion in March, compared to a 1.1% increase in the nominal deficit. The largest surpluses, in billions, occurred with the Netherlands ($5.4), South and Central America ($4.0), and Hong Kong ($2.2), while the largest deficits were with China ($24.1), European Union ($19.5), and Mexico ($13.5). –Delaney O’Kray-Murphy
The U.S. unemployment rate changed little in April at 3.9% while total nonfarm payroll employment increased by 175,000, according to the Bureau of Labor Statistics May 3rd employment situation summary. Among the major worker groups, the unemployment rate for adult men (3.6%) increased in April, while the rates for Blacks (5.6%) decreased, offsetting the previous month’s increase. The jobless rates for adult women (3.5%), teenagers (11.7%), Whites (3.5%), Asians (2.8%), and Hispanics (4.8%) showed little change over the month. Job gains occurred in health care (56,000), social assistance (31,000), transportation and warehousing (22,000), retail trade (20,000), construction (9,000), and government (8,000). Employment showed little or no change in other major industries. –Delaney O’Kray-Murphy
House prices in Phoenix increased 4.9% over the year in February. Nationally, house prices had an annual increase of 6.4% in February, up from 6.0% in January, according to the most recent S&P CoreLogic Case-Shiller Indices release. The 20-city composite index rose to a rate of 7.3% compared to 6.6% the prior month. San Diego was once again the metro area with the largest year-over-year escalation in house prices at 11.4%. Portland posted the smallest increase with an annual gain of 2.2%, a significant increase compared to the last several months. Prices rose over the month for most of the cities in the index during February, with only Tampa having a decrease and Cleveland holding steady. –Valorie Rice
The March 2024 release of the Job Openings and Labor Turnover (JOLTS) report stated that the number of job openings in the U.S. changed little to 8.5 million, and the job openings rate was 5.1%. The industry with the largest increase in state and local government education (+68,000). Construction was the industry with the largest decrease. The number of hires moved to 5.5 million, with a rate of 3.5% for March, 3.7% for February, and 3.6% for January. The number of total separations in the nation decreased to 5.2 million, with a rate of 3.3%. The number of quits was 3.3 million, with a rate of 2.1%. The number of layoffs and discharges changed little at 1.5 million, with a rate of 1.0%. –Alex Jaeger
According to the April 17th State Job Openings and Labor Turnover (JOLTS) report, job openings rates decreased in four states, increased in three states, and were little changed in all other states. Arizona was one of the top states to see an increase in job opening rates at (+1.0%). The job openings rates for Arizona were 5.2% for February, 4.2% for January, and 4.9% for December. The number of job openings decreased in six states, increased in four states, and were little changed in all other states. The largest decrease in the number of job openings was seen in Oregon (-28,000). The largest increase in the number of job openings was seen in Arizona (+37,000). Hire rates decreased in two states, increased in five states, and changed little in all other states. Tennessee saw the largest increase with +1.0 percentage point followed by Maine at +0.9 percentage points. The February hire rate for Arizona was unchanged at 3.9%. The number of hires decreased in three states, increased in six states, and changed little in all others. Florida (+56,000) and Tennessee (+35,000) saw the largest increases in hire levels. The number of layoffs and discharges decreased in one state, increased in seven states, and were little changed in all other states. The largest increase was seen in Texas (+57,000). Nationally, the layoffs and discharges rates and total separations rates were little changed. –Alex Jaeger
In March, Arizona over-the-year building permits saw a 17.8% over the year decrease to 5,363, not seasonally adjusted. The number of single-family permits saw an impressive 31.5% increase to 3,864. Maricopa County accounted for most of the permits within the state, with 3,514 total units (25.9% over the year decrease) and 2,106 single-family units (31.5% over the year increase). Pima County saw similar movements, with total units decreasing 35.6% to 484 and single-family units increasing 27.7% to 424. Pinal, Mohave, Yuma, Navajo, Coconino, Santa Cruz, and Gila saw over-the-year increases in total permits. Maricopa, Pima, Yavapai, Cochise, Graham, Apache, and La Paz saw decreases. Greenlee had no change. –Delaney O’Kray-Murphy