Stable Prices and Modest Income Growth Continued to Support the U.S. Economy
By: EBRC Research Staff
Current data as of 6 September 2026
Recent U.S. data releases showed stabilizing consumer and producer prices, but inflation remained elevated. Housing market activity continued to be subdued in the U.S. and in Arizona. Steady growth in the economy has relied on modest income growth and steady spending.
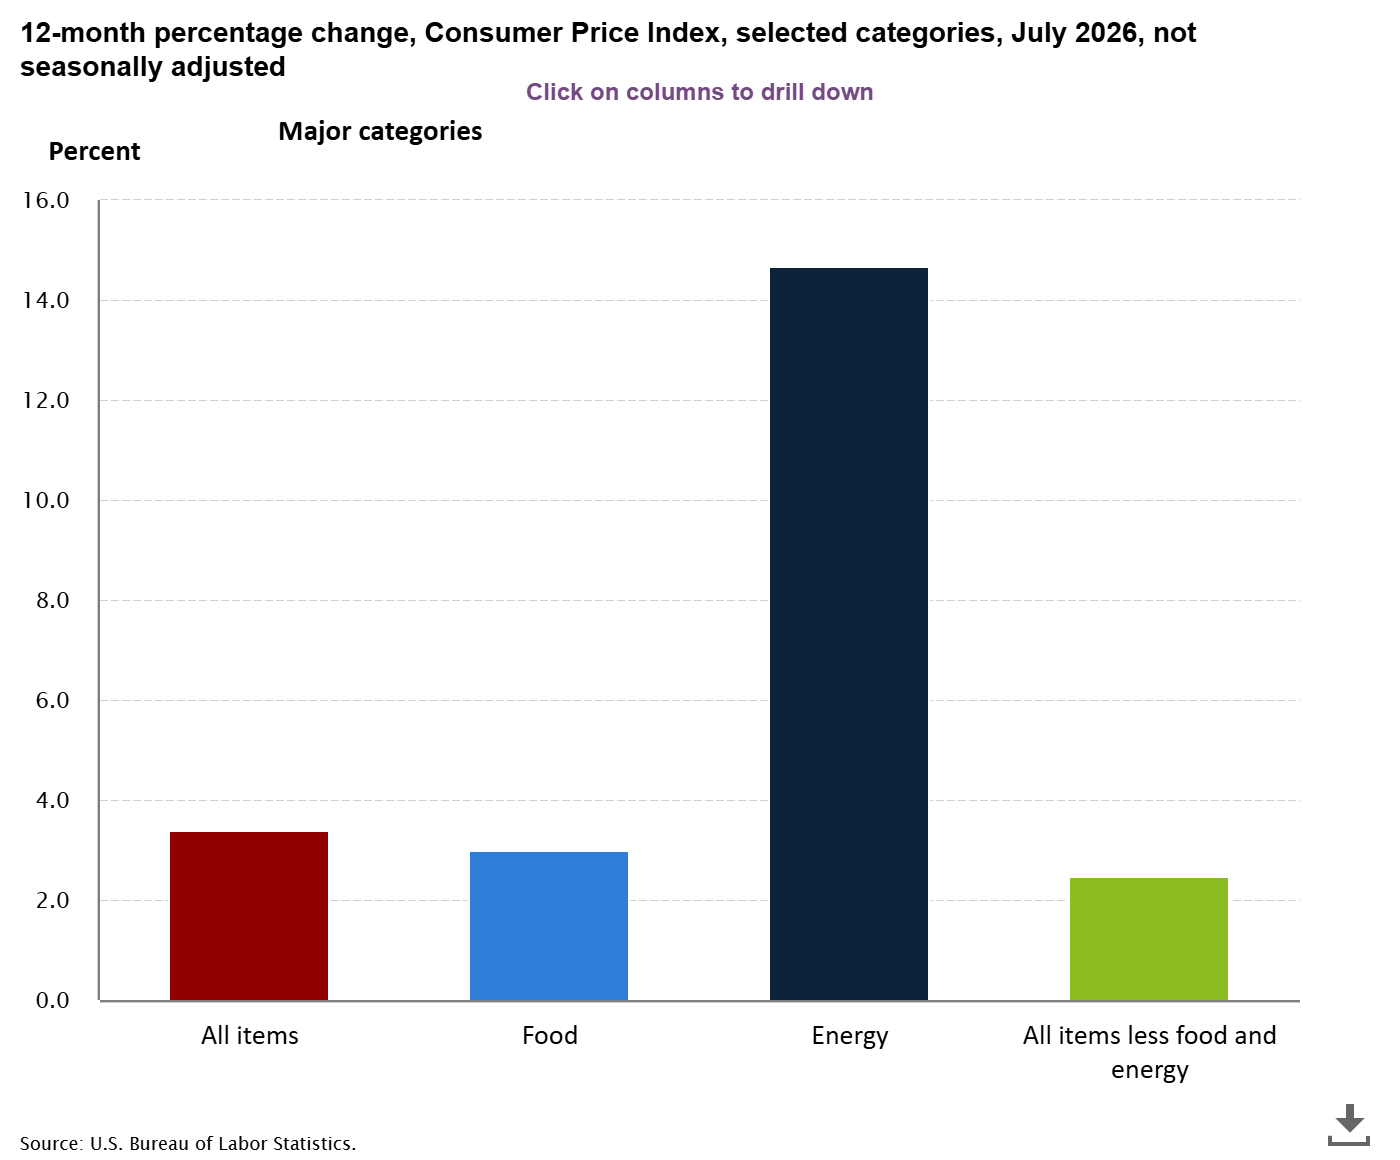
The U.S. Consumer Price Index (CPI) for All Items edged up by 0.1% over the month in July, compared to a 0.4% decrease in June. Gasoline prices declined 2.9% in the month, food prices increased 0.1%, and core prices excluding food and energy increased 0.2%. Over the year, the all-items index increased 3.4%, down from 3.5% in June. The all-items less food and energy (core) index rose 2.5% over the year, down slightly from 2.6% in the prior month.
Real average hourly earnings for all employees decreased 0.1% over the month in July, compared to a 0.7% increase in June. Real average hourly earnings for production and nonsupervisory employees were unchanged in July, with a 0.1% increase in nominal earnings. Over the year, real weekly earnings increased 0.1% in July, stemming from a 0.3% increase in average workweek and a 0.2% decrease in real average hourly earnings.
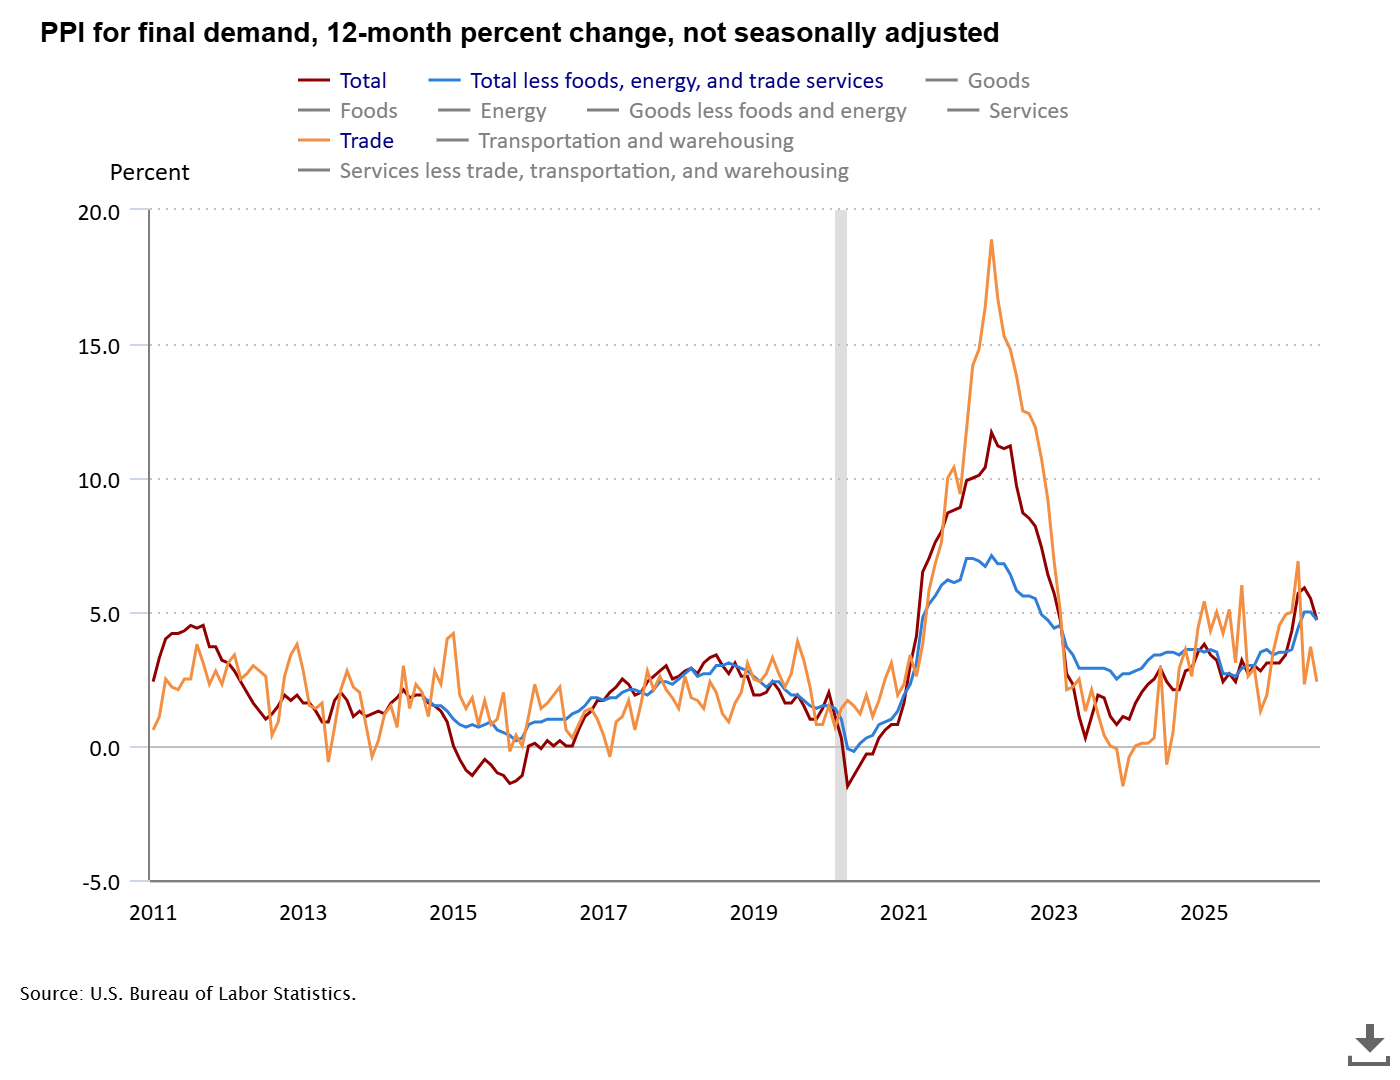
On the production side, the U.S. Producer Price Index for final demand was unchanged over the month in July, compared to a 0.1% decrease in June. Final demand goods prices decreased for another month, while final demand services prices edged up. The price index for final demand less food, energy, and trade decelerated to 4.7% in July from 5.0% in June. The price indexes for intermediate-demand goods inputs decreased from the prior month as gasoline prices moderated, whereas intermediate-demand services inputs increased modestly. – Niaoniao You
House price appreciation in Arizona was slim in the second quarter of 2026 compared with the same period in 2025, with an increase of just 0.6%. Nationally, house prices were up 2.1% annually in the second quarter, with Alaska posting the highest gain at 8.3%, followed by Vermont at 7.3%. Four states had declines in house prices over the year: California (-0.2%), Colorado (-0.5%), Washington (-0.9%), and New Mexico (-1.3%). These data are based on the purchase-only Federal Housing Finance Agency (FHFA) House Price Index. Data for Arizona metropolitan areas are available using the all-transactions index, which includes refinance and purchase data. Flagstaff had the state’s largest one-year increase at 2.9%, followed by Tucson at 1.9%, Phoenix at 0.8%, Yuma and Lake Havasu City-Kingman with no change, Prescott Valley-Prescott at -0.7%, and Sierra Vista-Douglas at -0.8%. For reference, the all-transactions index reported a 3.0% gain for the U.S. and 0.9% for Arizona. – Valorie Rice
Phoenix house prices were down 0.9% over the year in June, according to the S&P Cotality Case-Shiller Indices. Nationally, house prices posted an annual gain of 1.5% in June, up from 1.2% in May. The 20-city composite had a 2.1% gain, compared to 1.6% the prior month. Chicago had the largest change in house prices, at 6.9%, followed by New York at 4.8%. Most of the seven metropolitan areas recording decreased housing prices were in the West. Seattle had the largest decline, at -2.0%, followed by Las Vegas at -1.9% and Denver at 1.2%. – Valorie Rice
Total building permits in Arizona were down 25.0% year-over-year, with 3,392 permits in July, not seasonally adjusted. Single unit permits were 2,429 in July compared to 2,493 the prior year, a 2.6% decrease. The Phoenix metropolitan area similarly reported a 34.3% drop in total permits to 2,401 for the month. At 1,723 single unit permits for July, the Phoenix number was only 21 less than the same month a year ago. While Phoenix and the state reported lower overall building permits, the Tucson metropolitan area reported 564 total permits, an 84.3% increase. Likewise, single units were up 35.9%, at 328 compared to 256 in 2025. Yuma and Sierra Vista-Douglas were the only other metropolitan areas in the state to have a year-over-year increase in building permits for July, with Yuma reporting more than double the number of permits than the prior year (138 vs 37). – Valorie Rice
Real gross domestic product (GDP) for the second quarter grew at an annual rate of 1.5% in the second estimate released by the Bureau of Economic Analysis. The aggregate real GDP growth was the same as the advance estimate, with consumer spending revised up and net exports revised down with higher imports. Annualized growth of real final sales to private domestic purchasers, the sum of consumer spending and gross private fixed investment, was revised up to 4.2% from 3.9%. The personal consumption expenditures (PCE) price index increased 5.3% and PCE price excluding food and energy increased 3.6%, both of which were revised up 0.2% from the advance estimate.
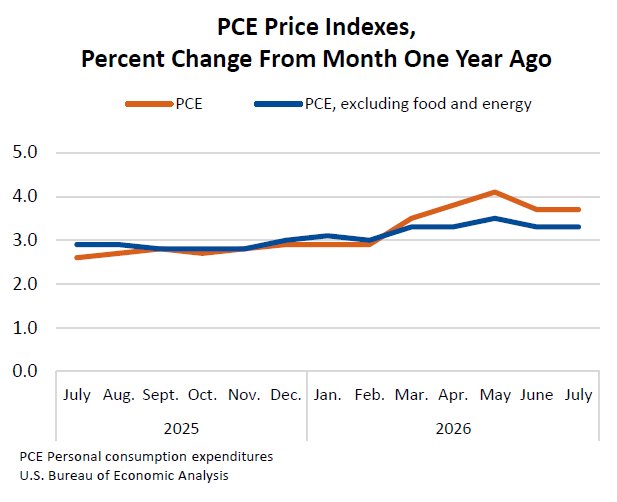
Personal income increased 0.4% over the month in July. Disposable personal income increased 0.5%, and personal consumption expenditures (PCE) increased 0.2%. Within PCE, goods spending edged down 0.1% in the month while services spending moved up 0.3%. The PCE price index increased 3.7% over the year in July, the same as June, with the core (excluding food and energy) PCE price index unchanged at 3.3%. – Niaoniao You
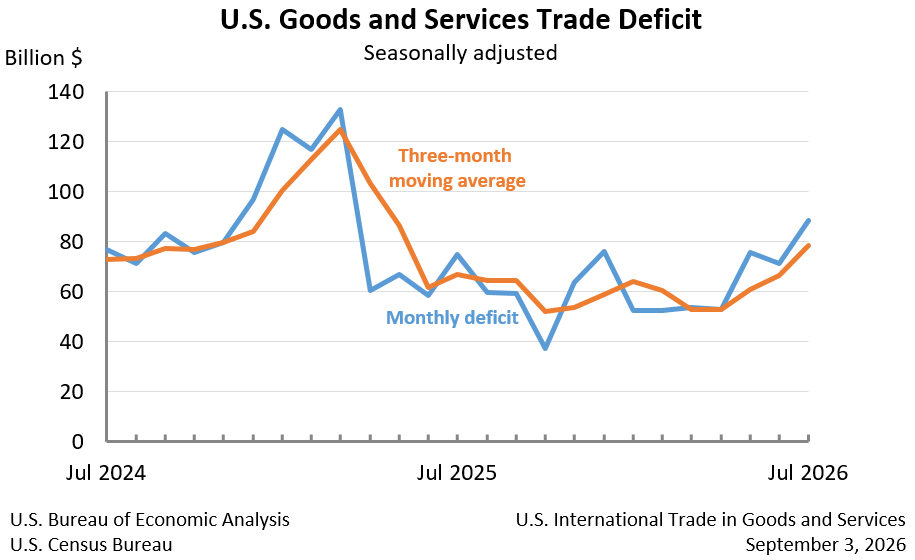
The U.S. trade deficit expanded in July to $88.6 billion from a revised $71.2 billion in June (revised down), according to the joint U.S. Census Bureau/U.S. Bureau of Economic Analysis release. Exports declined 2.1% in the month to $310.7 billion while imports increased 2.8% to $399.3 billion. Year-to-date, the goods and services deficit decreased 29.6% compared to the same period a year ago. The top countries in which the U.S. reflected a trade surplus were the Netherlands ($7.8 billion), South and Central America ($6.6 billion), and Hong Kong ($3.1 billion). The highest July deficits were with Mexico ($27.5 billion), Vietnam ($23.3 billion), and Taiwan ($18.1 billion). – Niaoniao You