Growth Amid Pressure: Stronger Economy, Higher Costs
Valorie Rice, Sr Business Information Specialist
Current data as of 6 November 2026
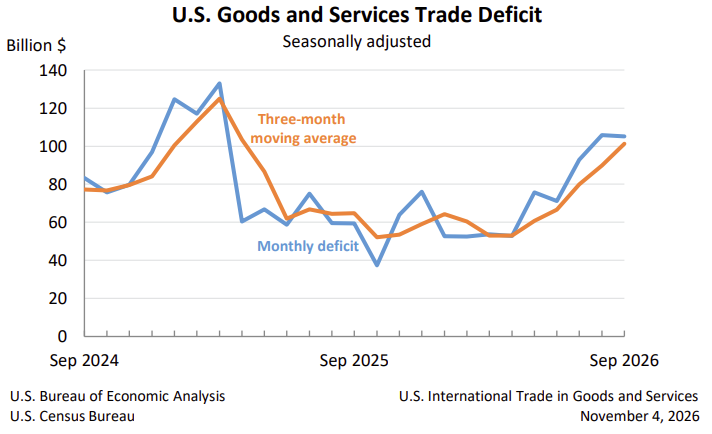
The U.S. trade deficit for September stood at $105.0 billion, down from a revised figure of $105.7 billion in August. Both exports and imports increased over the month, with exports rising to $321.5 billion while imports moved to a record level of $426.6 billion. In September, the largest trade surpluses, in billions of dollars, were with the Netherlands ($7.7), South and Central America ($6.2), and the United Kingdom ($3.0), while the largest deficits were with Mexico ($28.7), Vietnam ($25.3), and Taiwan ($21.9).
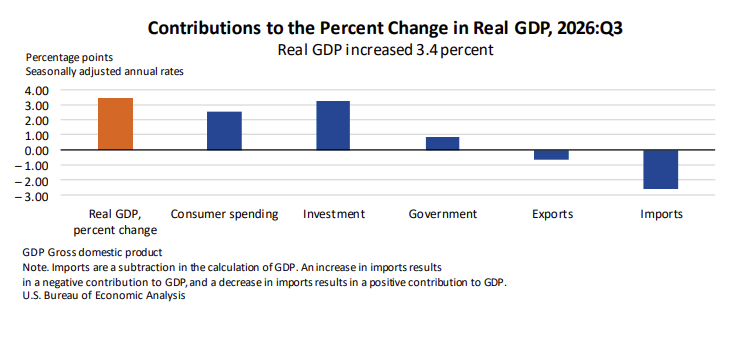
Real GDP increased at an annual rate of 3.4% in the third quarter of 2026 based on the advanced estimate from the U.S. Bureau of Economic Analysis October 29 release. Real GDP increased 2.2% in the second quarter. Contributing to the growth in the third quarter were investment, consumer spending, and government spending, which were partly offset by a decrease in exports. Investment and government spending were higher in the third quarter compared to the second. Imports, which are subtracted in the calculation of GDP, increased more in the third quarter than they had in the second. A second estimate for the third quarter GDP will be released November 25.
The Producer Price Index rose 1.3% in September on a seasonally adjusted basis. This was the largest monthly increase in producer prices since March 2022. Prices for final demand goods rose 2.6% over the month, with most of that attributable to energy, which surged 10.8%. Foods increased 1.2% over the month. On the other side, prices for final demand services rose 0.8% over the month, with transportation and warehousing services advancing 3.4%. The unadjusted 12-month change in producer prices for September was 5.0%, similar to the last several months.
The 2025 American Community Survey (ACS) one-year estimates were released October 29. Three new topics were covered in the 2025 ACS relating to electric vehicles, solar panels, and sewers. Every question has a federal use justified by federal law, and the new questions may seem odd, yet they serve important purposes in understanding the nation’s infrastructure. In 2025, there were about 122.3 million households in the U.S. that reported having access to at least one vehicle. We now know that about 7.3 million, or 5.5%, of those were all-electric or plug-in hybrid electric vehicles. California leads the nation in the share of electric vehicles, with 13.8% of households with at least one electric vehicle. This is followed by Washington (8.9%), Hawaii (8.5%), and Nevada (8.2%); all three were not significantly different from each other. Arizona is closer to the U.S. average, at 6.1%. North Dakota had the lowest share of electric vehicles at 1.3%. Arizona was among the states with the highest proportion of homes connected to public sewer systems rather than septic, likely due to the amount of newer construction. Hawaii had the largest share of homes with solar panels (30.4%), followed by California (17.1%), Arizona (11.8%), and Nevada (11.8%). North Dakota and South Dakota were on the other end of the spectrum with 0.6% of homes having solar panels.
Phoenix house prices increased 0.4% over the year in August based on the S&P Cotality Case-Shiller Index. This was lower than the national price change of 2.1% and the 20-city composite at 2.7% for the same period. Chicago posted an annual gain of 6.7%, placing it as the metropolitan area with the largest increase in house prices among the 20 regions tracked in the indices, a place it has held for the last six months. New York, at 6.2%, Cleveland at 4.3%, and Miami at 4.2% had the next highest price gains. Five metropolitan areas had year-over-year decreases in house prices, with Seattle posting the lowest at -2.0% followed by Las Vegas at -1.3%. Chicago and Miami were the only areas to post monthly increases between July and August.
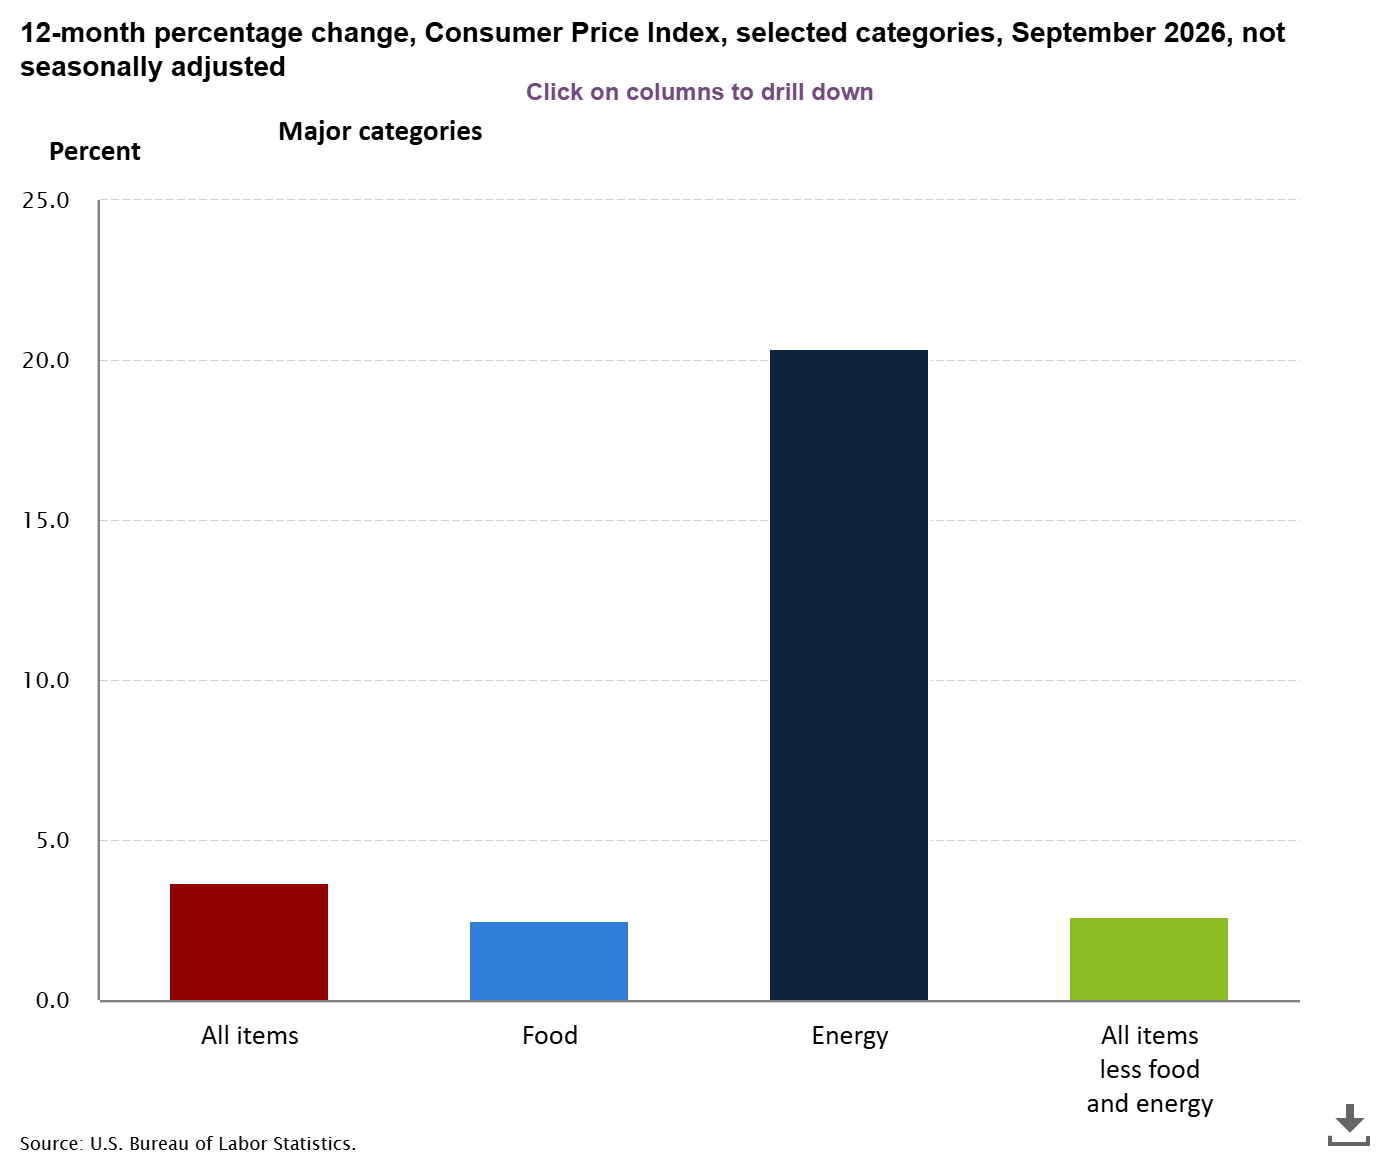
Energy prices accounted for over half of the increase in the September Consumer Price Index, which rose 0.6% over the month. The energy index rose 5.2% in September while the index for food was unchanged. The index for all items less food and energy increased 0.3% over the month. The annual inflation rate in September was 3.7%, up from 3.4% in August. The energy index also dominated the 12-month change, with a 20.4% increase compared to 2.5% for the food index and 2.6% for all items less food and energy.