
Arizona Economy Shows Resilience Amid Signs of Slower Growth
By: Niaoniao You, EBRC Senior Economic Forecaster
Cooling inflation and mixed labor market signals at midyear 2026
U.S. and Arizona economies showed resilience in the first half of 2026, with inflation easing in June and employment expanding over the year. Nonfarm payroll job gains, rising personal incomes, and moderate GDP growth suggest that Arizona remains on relatively solid footing, but the economy is increasingly characterized by slower growth and mixed labor market conditions. Rising unemployment and declining housing permits signaled softer underlying demand going forward. Overall, the economy continued to grow but at a slower and more uneven pace than in prior years.
Inflation eased in June as gasoline prices fell, following a temporary pause in hostilities in the Strait of Hormuz. The U.S. Consumer Price Index (CPI) for All Items decreased 0.4% over the month in June, down from a 0.5% increase in May. The deceleration was primarily driven by a 9.7% decline in gasoline prices. Over the year, the all-items index increased 3.5%, down from a recent peak of 4.2% in May. The all-items less food and energy (core) index rose 2.6% over the year, down slightly from 2.9% in the prior month. The U.S. and Iran had moved closer to resolving the conflict last month after signing a memorandum of understanding. However, renewed tensions continue to make developments in the Middle East a significant risk to gasoline prices and inflation.
The Phoenix MSA CPI for All Items increased 2.8% over the year in June, down from 3.0% in April and below the national pace of 3.5%, as shown in Exhibit 1. Gasoline prices returned to levels similar to March when the Strait of Hormuz blockade just started but remained elevated, up 26.2% over the year in June and 20.7% during the first half of the year. Consumer commodities prices (tangible goods, including food and energy) were up 5.0% over the year, while services prices increased 1.8%. Excluding food and energy, core prices were up 2.0% in June, compared to 1.7% in April, well below the national pace of 2.6%, due largely to slower shelter price growth (1.4% in Phoenix MSA compared to 3.3% nationally).
Exhibit 1: U.S. and Phoenix-Mesa-Scottsdale MSA CPI, Not Seasonally Adjusted, Over the Year, Percent
On the production side, the U.S. Producer Price Index for final demand fell 0.3% over the month in June, down from a 0.6% increase in May. The decrease was primarily driven by final demand goods (-1.4%), reflecting lower energy prices, while final demand services moved up 0.2%. The price index for final demand less food, energy, and trade stood at 5.1%, equal to May. The price indexes for intermediate-demand goods inputs decreased from the prior month as gasoline prices moderated, whereas intermediate-demand services inputs increased modestly.
In the first half of 2026, Arizona’s labor market recovered from job losses at the end of 2025 but still showed mixed signals. The seasonally-adjusted number of nonfarm payroll jobs in June increased by 23,600, or 0.7% over the year, compared to a flat job growth nationally. Over the month, the number of jobs rose 2,400, following a 1,200 decrease (revised down from a 2,000 increase) in May. However, unemployment rate edged higher again to 4.9% from 4.8% in May, reaching the highest level in five years, despite a shrinking labor force (which would lower the unemployment rate if unemployed workers dropped out of the labor force after becoming discouraged). In contrast, the U.S. unemployment rate during the same month edged down to 4.2% from 4.3%, helped by a smaller labor force.
The raw (not-seasonally-adjusted) number of jobs fell by 46,700 over the month of June, which was well within the typical range of decreases for June due to lower seasonal hiring in the summer. Trade, transportation, and utilities (4,700) and construction (2,900) gained the most jobs in the month, while government (-36,000) and leisure and hospitality (-11,100) sectors lost the most jobs. Also increasing in June were jobs in manufacturing (300), financial activities (300) and natural resources and mining (200). Private educational services (-4,800), health care and social assistance (-1,300), other services (-900), and information (-100) sectors lost jobs in the month.
Over the year, Arizona not-seasonally-adjusted nonfarm employment increased by 27,900 or 0.9% in June. Exhibit 2 shows Arizona net job changes by industry. Private education and health services and professional and business services sectors led job gains, along with trade, transportation, and utilities, other services, construction, natural resources and mining, and information. Those gains were partly offset by job losses in government, leisure and hospitality, financial activities, and manufacturing. Please find more details about Phoenix, Tucson, and Prescott job changes at the end of this article.
Exhibit 2: June 2026 Arizona Net Job Change (Thousands) and 2024 Annual Wages per Worker
Employment trends varied across Arizona’s metropolitan areas, reflecting differences in local industry composition and economic conditions. Phoenix MSA (Maricopa and Pinal counties) jobs rose by 33,200, or 1.4% over the year in June. Similar to the state, Phoenix job gains were driven primarily by private education and health services, and professional and business services (Exhibit 3). Trade, transportation, and utilities, construction, other services, and natural resources and mining sectors also added jobs. Leisure and hospitality, financial activities, government, and manufacturing sectors lost jobs.
Exhibit 3: Phoenix MSA Net Job Change (Thousands) and 2024 Annual Wages per Worker
Tucson MSA’s total nonfarm employment increased by 1,300, or 0.3% over the year in June. Jobs increased the most in private education and health services; professional and business services; and other services (Exhibit 4). Natural resources and mining, information, and government also added jobs. Those gains were partially offset by losses in leisure and hospitality, financial activities, manufacturing, trade, transportation, and utilities, and construction sectors.
Exhibit 4: Tucson MSA Net Job Change (Thousands) and 2024 Annual Wages per Worker
Prescott MSA’s jobs were flat over the year in June. Job gains were from private education and health services, government, and trade, transportation, and utilities sectors (Exhibit 5). Those gains were offset by losses in leisure and hospitality, professional and business services, and manufacturing sectors. Jobs were unchanged over the year in information, financial activities, and other services.
Exhibit 5: Prescott MSA Net Job Change (Thousands) and 2024 Annual Wages per Worker
As another big component of the economy, housing activities remained subdued in the first five months of 2026, with housing permits in Arizona, Phoenix, and Tucson falling closer to pre-pandemic levels, as seen in Exhibit 6. May building permits for Arizona totaled 2,961, 34.4% lower than the same month a year ago, with single-family permits down 21.6% to 2,537. The Phoenix-Mesa-Chandler metropolitan area recorded 2,255 total and 1,895 single-family permits for May, down 35.0% and 16.3% over the year, respectively. Likewise, the Tucson metropolitan area posted declines in building permits over the year, with total permits dropping 21.4% to 319, and single-family permits decreasing 21.9% to 275. Yuma was the only county that had a higher number of single-family building permits compared to the same month last year. Coconino county had no change, and all others recorded declines.
Exhibit 6: New Private Building Permits Issued in Arizona, Phoenix, and Tucson, Monthly
More comprehensive growth and income data showed resilience in the Arizona economy early this year. Arizona real GDP rose by 1.4% at an annual rate in the first quarter of 2026, compared to the U.S. at 2.1%. Growth slowed from 1.5% in the prior quarter but rebounded from -3.8% in the same quarter a year ago. Sectors generating growth in Arizona real GDP were manufacturing, information, government, professional and business services, private education and health services, and natural resources and mining. Real GDP was down in trade, transportation, and utilities, finance, insurance, and real estate, construction, leisure and hospitality, and other services.
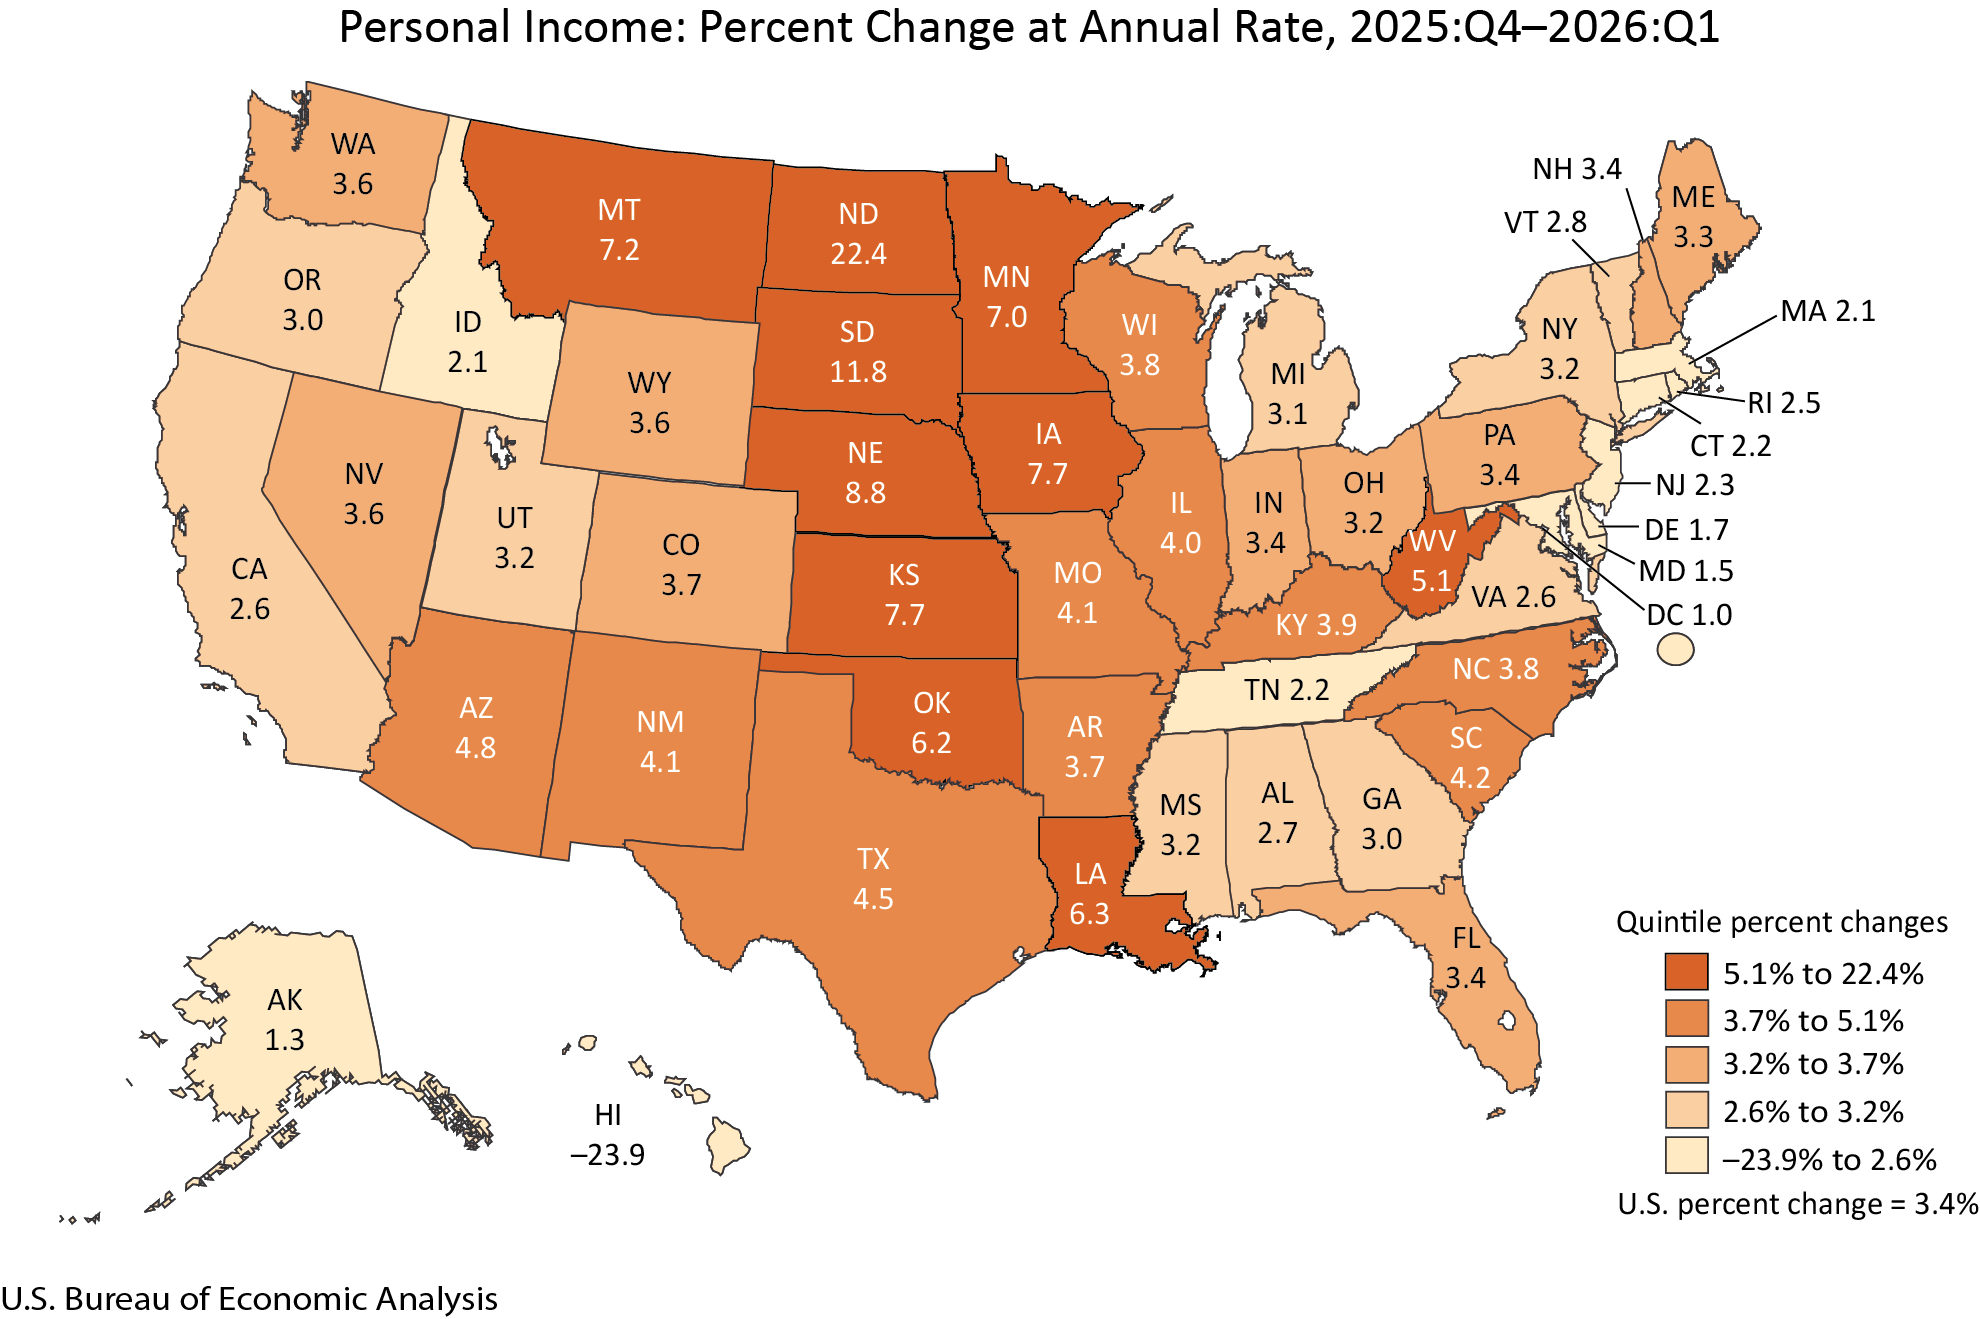
Arizona personal income increased 4.8% at an annual rate in the first quarter, well above the national pace of 3.4%, as shown in Exhibit 7. Net earnings from work (wages and salaries, proprietor’s income, and fringe benefits) rose 2.0%, below the national pace of 3.1%. For Arizona, that was a slowdown from the 3.3% annualized growth in the last quarter of 2025 but an acceleration from 0.3% a year ago. Income from dividends, interest, and rent rose 5.1%, above the national pace of 4.2%. Transfer receipts (Social Security, Medicare, Medicaid, welfare, etc.) rose 12.4% in Arizona and 3.7% nationally.
Exhibit 7: State Personal Income, 2026Q1, Percent Change at Annual Rate
As Arizona moves into the second half of 2026, labor market, housing, and inflation trends will provide important signals about the state’s economic trajectory.