

By Valorie Rice, Senior Business Information Specialist.
Every five years we get a glimpse into the agricultural industry via the Census of Agriculture. The report provides data on crops, livestock, and farmland, but even more, it provides information for people working on farms and ranches across the nation. The Census of Agriculture continues to add more demographic information alongside the industry statistics it provides. Information about the military service of farmers was included for the first time in 2017. This was also the first time data were collected for up to four producers per farm instead of just one as in the past. This better reflects the reality of many family-run farms and ranches where a husband and wife, father and son, siblings, or hired managers often jointly manage and make decisions for the operation. Arizona farmers prove to be older, more experienced and more diverse, with a larger share of women and Native American farmers than the U.S. The Census of Agriculture also continues to improve on the number of individual farm operations that respond to the census, which is of particular note for Arizona where the number of farms on reservation land make up a large portion of total farms (and were not well represented in the Census prior to 2007).
Number of Farms
There were 19,086 farms in Arizona for 2017, 4.6 percent fewer than in 2012. The size of farms, however, increased. Figure 1 shows the total number of farms in Arizona by size for 2012 and 2017. The number of farms with 1,000 or more acres increased from 5.5 percent of all farm operations to 11.0 percent while farms with less than 50 acres went from 79.9 percent down to 69.1 percent. The average size of farm in Arizona increased modestly to 1,369 acres. This was much larger than the nation at 441 acres. Western states tend to have more acreage per farm and the average size was more than 1,000 acres for Wyoming, Montana, Nevada, New Mexico, North Dakota, South Dakota, and Arizona.
Figure 1: Arizona Farms by Size
| Acres | ||||||||
| 1-9 | 10 to 49 | 50 to 179 | 180 to 499 | 500 to 999 | 1,000 plus | Total | Avg. Size | |
| Arizona 2017 | 9,436 | 3,753 | 1,748 | 1,085 | 963 | 2,101 | 19,086 | 1,369 |
| % of total | 49.4 | 19.7 | 9.2 | 5.7 | 5.0 | 11.0 | ||
| Arizona 2012 | 11,911 | 4,082 | 1,517 | 882 | 513 | 1,100 | 20,005 | 1,312 |
| % of Total | 59.5 | 20.4 | 7.6 | 4.4 | 2.6 | 5.5 | ||
| U.S. 2017 | 273,325 | 583,001 | 564,763 | 315,017 | 133,321 | 172,793 | 2,042,220 | 441 |
| % of Total | 13.4 | 28.5 | 27.7 | 15.4 | 6.5 | 8.5 | ||
| Source: U.S. Dept. of Agriculture, National Agricultural Statistics Service and Economic and Business Research Center, The University of Arizona. |
||||||||
Apache County had the largest number of farms in the state with 5,551 followed by Navajo County at 4,205. These two counties also were home to the largest number of smaller and larger farms. The average size of farm was largest in Gila County. Coconino County had the most acreage devoted to farming and ranching.
Figure 2: Farms by Size in Arizona Counties
| Acres | |||||||||
| 1-9 acres | 10 to 49 | 50 to 179 | 180 to 499 | 500 to 999 | 1,000 plus | Total Farms | Total Acres | Avg Size | |
| Arizona | 9,436 | 3,753 | 1,748 | 1,085 | 963 | 2,101 | 19,086 | 26,125,819 | 1,369 |
| Apache | 2,829 | 1,186 | 450 | 276 | 227 | 583 | 5,551 | 5,554,963 | 1,001 |
| Cochise | 161 | 268 | 267 | 126 | 69 | 192 | 1,083 | 973,407 | 899 |
| Coconino | 1,321 | 346 | 151 | 53 | 22 | 249 | 2,142 | 6,139,007 | 2,866 |
| Gila | 133 | 67 | 53 | 21 | 9 | 15 | 298 | 1,214,134 | 4,074 |
| Graham | 208 | 80 | 68 | 18 | 29 | 45 | 448 | 1,290,391 | 2,880 |
| Greenlee | 16 | 48 | 25 | 15 | 9 | 10 | 123 | 65,911 | 536 |
| La Paz | 9 | 19 | 18 | 17 | 8 | 26 | 97 | 249,723 | 2,574 |
| Maricopa | 1,144 | 387 | 126 | 72 | 56 | 89 | 1,874 | 474,438 | 253 |
| Mohave | 115 | 77 | 20 | 28 | 22 | 55 | 317 | 745,415 | 2,351 |
| Navajo | 2,315 | 501 | 263 | 259 | 371 | 496 | 4,205 | 4,413,121 | 1,049 |
| Pima | 356 | 171 | 49 | 19 | 14 | 52 | 661 | 2,617,789 | 3,960 |
| Pinal | 262 | 166 | 79 | 71 | 63 | 121 | 762 | 1,120,637 | 1,471 |
| Santa Cruz | 38 | 67 | 48 | 23 | 7 | 36 | 219 | 197,735 | 903 |
| Yavapai | 372 | 250 | 81 | 45 | 30 | 72 | 850 | 821,929 | 967 |
| Yuma | 157 | 120 | 50 | 42 | 27 | 60 | 456 | 247,219 | 542 |
| Source: U.S. Dept. of Agriculture, National Agricultural Statistics Service and Economic and Business Research Center, The University of Arizona. |
|||||||||
Agricultural Products
Arizona remains a top state for vegetables and melons, ranking fifth out of all states. Yuma County is among the top three counties in the U.S. for the vegetables, melons, potatoes, and sweet potatoes commodity category. The top three agricultural products by market value in Arizona represent 65 percent of all sales for the state. These were vegetables, melons, potatoes, and sweet potatoes followed by milk from cows and cattle and calves (Figure 3). Milk from cows is the top commodity for Maricopa County and it ranks sixth in the nation for all counties producing milk.
While the state ranks high for select commodities, Arizona’s total of $3.85 million represents only 1 percent of sales for the nation and ranks 30th out of all states. California surpasses all states in commodity sales and average sales per farm. In fact, a single county in California (Fresno) had larger agricultural sales than 25 states, including Arizona.
Figure 3: Market Value of Agricultural Products Sold for Arizona in 2017, Ranked by Sales
| Farms | Sales ($1,000) | Rank | % of Total Sales | |
| Total sales | 19,086 | 3,852,008 | 100.0 | |
| Vegetables, melons, potatoes, and sweet potatoes | 1,115 | 1,009,125 | 1 | 26.2 |
| Milk from cows | 86 | 856,376 | 2 | 22.2 |
| Cattle and calves | 3,812 | 641,182 | 3 | 16.6 |
| Other crops and hay | 1,026 | 401,709 | 4 | 10.4 |
| Nursery, greenhouse, floriculture, and sod | 271 | 195,925 | 5 | 5.1 |
| Cotton and cottonseed | 283 | 184,002 | 6 | 4.8 |
| Poultry and eggs | 984 | (D) | 7 | (D) |
| Grains, oilseeds, dry beans, and dry peas | 1,799 | 157,833 | 8 | 4.1 |
| Fruits, tree nuts, and berries | 818 | (D) | 9 | (D) |
| Hogs and pigs | 372 | (D) | 10 | (D) |
| Horses, ponies, mules, burros, and donkeys | 1,546 | 32,934 | 11 | 0.9 |
| Sheep, goats, wool, mohair, and milk | 4,063 | 8,911 | 12 | 0.2 |
| Aquaculture | 31 | (D) | 13 | (D) |
| Other animals and other animal products | 534 | 5,510 | 14 | 0.1 |
| Cultivated Christmas trees & short rotation woody crops | 4 | (D) | 15 | (D) |
| Source: U.S. Dept. of Agriculture, National Agricultural Statistics Service and Economic and Business Research Center, The University of Arizona. | ||||
Maricopa County had the highest market value of products sold in the state, followed by Yuma County. Maricopa, Yuma, and Pinal counties combined accounted for 83 percent of the total for the state. Figure 4 shows Arizona counties by value of agricultural products sold and the percent of sales for either crops or livestock, poultry, and products. Items such as milk and eggs are included in livestock, poultry, and products. The percentage for the value of crops versus livestock was 50-50 in the U.S. for 2017.
Figure 4: Market Value of Agricultural Products Sold by County
| Sales ($1,000) | % Crop Sales | % Livestock Sales | |
| Arizona | 3,852,008 | 54 | 45 |
| Apache | 18,003 | 20 | 80 |
| Cochise | 144,741 | 57 | 43 |
| Coconino | 23,909 | 4 | 96 |
| Gila | 7,260 | 8 | 92 |
| Graham | 62,074 | 88 | 12 |
| Greenlee | 8,689 | 25 | 75 |
| La Paz | 160,152 | (D) | (D) |
| Maricopa | 1,209,132 | 39 | 61 |
| Mohave | 32,293 | 71 | 29 |
| Navajo | 49,917 | 9 | 91 |
| Pima | 75,469 | 84 | 16 |
| Pinal | 861,939 | 36 | 64 |
| Santa Cruz | 19,631 | 49 | 51 |
| Yavapai | 35,732 | 40 | 60 |
| Yuma | 1,143,068 | (D) | (D) |
| Source: U.S. Dept. of Agriculture, National Agricultural Statistics Service and Economic and Business Research Center, The University of Arizona. | |||
Organic and Direct Sales
The number of farms in Arizona selling organic products stayed virtually the same between 2012 and 2017. Total sales, however, increased by 80 percent in that time. Arizona had 75 farms with $54,503,000 in organic product sales in 2012. In 2017, the number of farms was 74, yet sales increased to $97,956,000, accounting for 2.5 percent of total farm sales for the state. The number of farms with USDA National Organic Program certified organic production increased from 42 to 67 between 2012 and 2017, with the majority of these in Maricopa and Yuma counties.
More than 75 percent of the 826 farms in Arizona selling directly to customers were smaller than 50 acres. These same small farms accounted for the majority of sales for food sold directly to customers. This includes sales of edible agricultural products both produced and sold by the operation to consumers via farmers markets, on farm stores, roadside stands, u-pick, CSA or online marketplaces. There were 187 farms in Arizona with sales to retail markets, institutions, and food hubs for local or regional branding. Most of these farms were under 50 acres, but majority of sales for the state came from very large farms (more than 2,000 acres). California was the state with the most farms and commodity sales for operations marketing direct to consumers as well as to retailers.
Demographics
For the first time, the census questionnaire allowed for up to four people per farm to be listed as producers while in previous years it was limited to just one “principal operator”. A producer is a person involved in making decisions for the farm operation. This can be an owner, a member of the owner’s household, a hired manager, a tenant, renter, or sharecropper. (This article uses the terms producer and farmer or rancher interchangeably.) More than 95 percent of farms in the U.S. are family farms, as are nearly that many in Arizona (94.7 percent). Allowing for more than one producer better reflects the reality of family-run farms and ranches where a husband and wife, father and son, or siblings often jointly manage and make decisions for the operation. While it allows for richer information, direct comparison with previous census years is unfeasible. The current data, however, are interesting and Arizona stands out in several areas.
Since the census asked for the number of producers per farm, let us look at how Arizona compares to the nation. Figure 5 indicates the number and percent of farms by the number of producers. More than 50 percent of all farms in the U.S. and Arizona have more than one person involved in making decisions for the farm. Arizona has a larger percent of farms with a single producer, yet it also has a larger percentage than the nation for farms with more than two producers. A small number of farms list more than four producers, however the demographic data provided in census results includes only up to four persons per farm.
Figure 5: Farms by Number of Producers
| Producers per Farm | |||||
| 1 | 2 | 3 | 4 | 5 or more | |
| Arizona | 9,130 | 7,354 | 1,450 | 803 | 349 |
| % of farms | 48 | 39 | 8 | 4.2 | 1.8 |
| U.S. | 931,799 | 930,782 | 112,085 | 47674 | 19880 |
| % of farms | 46 | 46 | 5 | 2.3 | 1.0 |
| Source: U.S. Dept. of Agriculture, National Agricultural Statistics Service and Economic and Business Research Center, The University of Arizona. | |||||
The profile of Arizona farmers and ranchers differs from the nation in several compelling ways. The number of female farmers in Arizona is nearly equal that of males. At 48.7 percent, Arizona has the largest percentage of female farmers of any state and far above the national figure of 36.1 percent. Coconino was the county with the largest percentage of female producers, at 55.4 percent, while La Paz had just 19.6 percent.
The vast majority of farmers and ranchers in the U.S. were white in 2017, 95.4 percent, in fact. This was not the case for Arizona, where the figure was 39.7 percent. Arizona had the lowest percentage of any state by far, Hawaii being next with 51.8 percent white followed by New Mexico at 77.8 percent. Farmers in Arizona were predominately American Indian or Alaska Native at 58.8 percent, versus only 1.7 percent nationally. Most Native American farmers in Arizona reside in three counties: Apache, Navajo, and Coconino. (These figures represent white and American Indian or Alaska Native races alone. Percentages would be slightly higher if they included race alone and in combination with other races.) In a state with more than 30 percent of the population Hispanic or Latino, only 4.5 percent of Arizona’s farmers were Hispanic. This was similar to the nation, where 3.3 percent of farmers were Hispanic.
The average age of producers in Arizona was 59.4 years. This was higher than the U.S. average of 57.5 years and only two states were older: Hawaii with 60.1 years and New Mexico with 59.8 years. Within Arizona, only Pinal and Yuma had a lower average age than the nation. Greenlee was the county with the oldest producers at an average age of 62.5 years.
Farming and ranching can often be a life-long occupation. In Arizona, the average number of years spent working on any farm was 26.0 years, compared to 23.4 years for the nation. Iowa farmers have the longest time spent on a farm at an average 27.2 years while Alaska averages just 16.9 years. In Arizona, the range goes from 28.9 years in Navajo County down to 19.3 years in Santa Cruz County. Over 50 percent of producers in Arizona indicated farming was their primary occupation (55.0 percent) and 41.9 percent had no days of work off the farm, meaning they did not have any other jobs.
New to the 2017 Census of Agriculture is the number of farmers and ranchers who have served or are serving in the military. That number was 370,619 in the U.S., coming out to 10.9 percent of all producers. The state with the largest percentage of farmers who have served in the military was South Carolina at 13.7 percent and Utah had the least at 7.9 percent. The number of farmers or ranchers in Arizona who have served in the military was 2,861, or 8.7 percent, placing it among the bottom 10 states for military service.
Figure 6: Demographics of Producers
| Total | Male | Female | % American Indian | Avg. Age | Avg. Years Farming | Military Service | |
| U.S. Total | 3,399,834 | 2,172,373 | 1,227,461 | 1.7 | 57.5 | 23.4 | 370,619 |
| Arizona | 32,796 | 16,828 | 15,968 | 58.8 | 59.4 | 26 | 2,861 |
| Apache | 8,979 | 4,234 | 4,745 | 93.6 | 59.4 | 28.8 | 563 |
| Cochise | 1,918 | 1,123 | 795 | 1.6 | 58.1 | 20 | 330 |
| Coconino | 3,855 | 1,719 | 2,136 | 89.8 | 60.4 | 28.1 | 285 |
| Gila | 484 | 306 | 178 | 17.4 | 61.7 | 22.1 | 66 |
| Graham | 735 | 478 | 257 | 18.1 | 59.9 | 21.7 | 116 |
| Greenlee | 235 | 144 | 91 | N/A | 62.5 | 27 | 35 |
| La Paz | 153 | 123 | 30 | 30.1 | 57.9 | 20.8 | 9 |
| Maricopa | 3,177 | 1,782 | 1,395 | 2.4 | 59.3 | 22.7 | 387 |
| Mohave | 588 | 332 | 256 | 10.7 | 59.9 | 20.2 | 67 |
| Navajo | 7,557 | 3,610 | 3,947 | 89.0 | 59.0 | 28.9 | 436 |
| Pima | 1,078 | 603 | 475 | 13.9 | 60.1 | 24.1 | 81 |
| Pinal | 1,375 | 793 | 582 | 5.6 | 57.1 | 20.9 | 130 |
| Santa Cruz | 415 | 239 | 176 | 0.5 | 59.5 | 19.3 | 56 |
| Yavapai | 1,472 | 799 | 673 | 1.2 | 61.5 | 21 | 217 |
| Yuma | 775 | 543 | 232 | 0.6 | 56.6 | 20.7 | 83 |
| Source: U.S. Dept. of Agriculture, National Agricultural Statistics Service and Economic and Business Research Center, The University of Arizona. |
|||||||
Business Trends and Practices
The average market value of products sold per farm in Arizona increased since 2012, but so did production expenses, leaving net cash farm income considerably lower than the previous census, falling from $30,012 in 2012 to $18,231 in 2017. Net cash income measured as a per farm average was already lower in Arizona that the nation in 2012. It is now less than half that of the national average net cash farm income of $43,053. There was a large disparity between counties, with per farm average net cash income ranging from -$9,333 in Yavapai to $317,599 in Yuma.
Businesses now rely on computers and the internet more than ever including farms and ranches. Arizona however remains the least connected state when it comes to agriculture. The number of farm operations having internet connection in 2017 increased by 2,010 from 2012, yet Arizona is still the state with the smallest share of farms having internet access at 57.4 percent. New Mexico is slightly better with 60.5 percent. Nationally, 75.4 percent of farms have internet access. Of the farms and ranches that do have internet access in Arizona, it comes mostly from mobile internet service for cell phones or other devices followed by satellite and DSL services. Figure 7 includes a U.S. map depicting farms with internet access by county in 2017. It shows that while some counties in Arizona have farms with equivalent access as the nation, others have very little access.
Figure 7: Farms with Internet Access, Percent by County, 2017
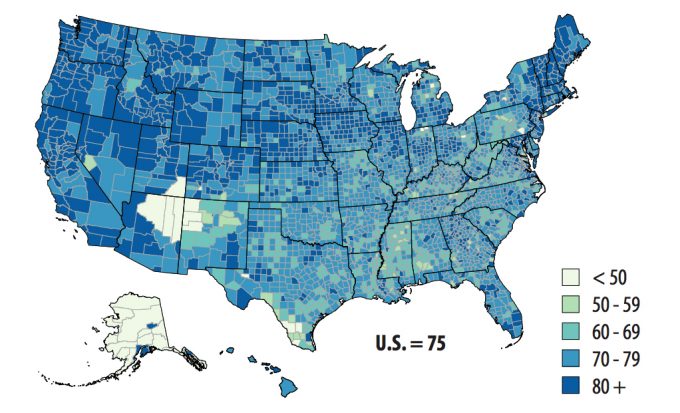
In 2017, 75 percent of U.S. farms had internet access, up from 70 percent in 2012. Rates are higher in western and northern states.
Source: U.S. Dept. of Agriculture, National Agricultural Statistics Service
The number of farms utilizing renewable energy is growing. In 2017, 7.6 percent of all farms in Arizona had some sort of renewable energy producing system, up from 4 percent in 2012. The increase was even more prominent in the U.S., moving from 2.7 percent of farms in 2012 to 6.5 percent in 2017. The vast majority of renewable energy in Arizona came from the use of solar panels (1,337 out of the 1,444 farms using renewables) followed by wind turbines and other. Nationally, solar was the top renewable energy source followed by geothermal/geoexchange systems and wind turbines.
One final piece of information new for the 2017 Agricultural Census pertains to barns. This was the first year for the question of how many farms had a barn built before 1960. Arizona happens to have 793 of them!


