
Valorie Rice, Senior Business Information Specialist
Current data releases as of 1 October 2021
August unemployment rates varied from 2.2 percent in Nebraska to 7.7 percent in Nevada. Arizona, Louisiana, and New Mexico had the largest over-the-month unemployment rate decreases at -0.4 percent point each, according to the State Employment and Unemployment release dated September 17. Arizona’s August unemployment rate of 6.2 percent (Exhibit 1) was a full percentage point higher than the U.S. at 5.2 percent. All states but one had a lower jobless rate in August compared to a year ago and one state was little changed.
Exhibit 1.
Visit Arizona’s Economy unemployment rate page for more data and info
The Consumer Price Index rose 0.3 percent in August on a seasonally adjusted basis. This was a bit lower than recent monthly increases based on information provided in the September 14 Bureau of Labor Statistics release. The index for food increased 0.4 percent with food at home and food away from home increasing the same amount at 0.4 percent. Energy prices were up 2.0 percent mainly due to gasoline. The index for all items less food and energy increased 0.1 percent for the month, the smallest change it has had since February. The annual inflation rate for August was 5.3 percent.
Exhibit 2.
Visit Arizona’s Economy inflation and prices page for more data and info
Median household income in the U.S. for 2020 was $67,521, 2.9 percent lower than it had been in 2019 according to the U.S. Census Bureau Income, Poverty and Health Insurance Coverage in the United States: 2020 report released September 14. The official poverty rate in 2020 was 11.4 percent, up 1.0 percentage point from 2019. These data come from the Current Population Survey Annual Social and Economic Supplement (CPS ASEC). Unfortunately, data are not available at the state level because the 2020 American Community Survey (ACS) one-year estimates were not released due to impacts of the COVID-19 pandemic on data collection. Data based on the 2020 ACS five-year estimates will be released in December.
Arizona’s total monthly nonfarm job growth was 1.8 percent in August, with year-over-year growth of 5.8 percent before seasonal adjustment. Government gained the most jobs over the month, mostly due to the start of a new school year, though was the only sector to record job losses over the year. August employment growth in Arizona metropolitan areas, not seasonally adjusted were: Prescott 7.9 percent, Yuma 6.7 percent, Phoenix 6.5 percent, Flagstaff 5.3 percent, Lake Havasu City-Kingman 4.7 percent, Tucson 4.1 percent, and Sierra Vista-Douglas 2.6 percent. Arizona’s seasonally adjusted unemployment rate for August was 6.2 percent, down from 6.6 percent in July.
Exhibit 3.
Visit Arizona’s Economy employment page for more data and info
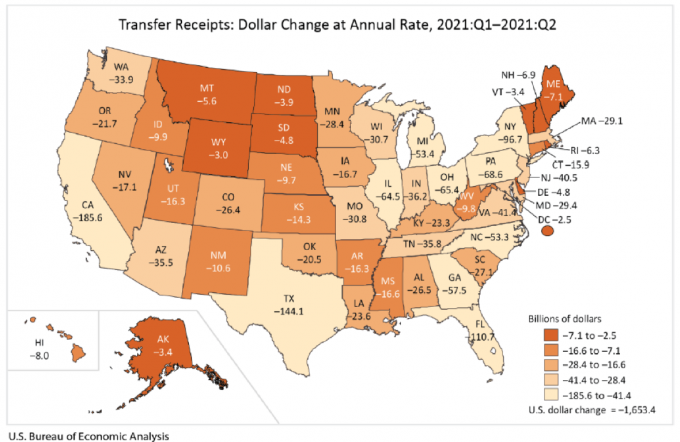
Arizona personal income fell by 26.5 percent in the second quarter 2021. The state was not alone, as all 50 states and the District of Columbia experienced decreases in personal income for the second quarter as federal income support declined. The percent change in personal income varied from -10.1 percent in the District of Columbia to -34.0 percent in West Virginia as reported by the Bureau of Economic Analysis September 23 release. The U.S. growth rate was -21.8 percent (compared to 59.7 percent in the first quarter 2021). Transfer receipts decreased $1.7 trillion nationally in the second quarter, accounting for more than the entire $1.3 trillion decrease in personal income. This reflected a reduction in direct economic impact payments by the CARES Act, American Rescue Plan Act, and decrease in state unemployment insurance compensation. Exhibit 4 displays the dollar change in transfer receipts by state between the first and second quarter. Earnings increased 10.7 percent in the U.S. but was swamped by the decrease in transfer receipts of 72.6 percent. Arizona had an 8.4 percent increase in net earnings and a 72.9 percent decrease in transfer receipts.
Exhibit 4.
Phoenix topped home price increases again in July. Phoenix at 32.4 percent, San Diego at 27.8 percent and Seattle at 25.5 percent for July have held the same top three slots since February of this year when San Diego replaced Seattle as second. Home price increases in July continued record highs for the fourth month in a row with a 19.7 percent annual gain according to the S&P CoreLogic Case-Shiller September 28 release. The 20-city composite posted a gain of 19.9 percent in July, up from 19.1 percent in June. The smallest one-year increase in home prices was in Chicago at 13.3 percent.
Most metropolitan areas had lower unemployment rates in August than the same month a year ago based on the Metropolitan Area Employment and Unemployment release dated September 29. There were 43 metro areas with jobless rates less than 3.0 percent while four areas had rates of at least 10.0 percent. One of those metro areas was in Arizona, as Yuma posted a rate of 18.2 percent for August. This was not the highest rate in the nation, as that distinction went to El Centro, CA with 19.4 percent. The lowest unemployment rate was in Lincoln, NE at 1.7 percent. The unadjusted employment rates for Arizona metropolitan areas in August were 6.4 percent in Flagstaff, 6.0 percent in Lake Havasu City-Kingman, 4.8 percent in Phoenix, 4.3 percent in Prescott, 5.2 percent in Sierra Vista-Douglas, 5.3 percent in Tucson, and 18.2 percent in Yuma.
US real GDP increased at an annual rate of 6.7 percent in the second quarter 2021 based on the September 30 Bureau of Economic Analysis release. This was slightly higher than previous estimates. Real GDP increased 6.3 percent in the first quarter.
Real GDP increased at an annual rate of 5.6 percent in Arizona during the second quarter 2021. All 50 states and the District of Columbia had increases in GDP for the second quarter according to the October 1 Bureau of Economic Analysis release. Nevada had the largest increase at 9.7 percent while Alaska had the smallest at 1.8 percent. Professional, scientific, and technical services contributed to the increases in all 50 states and the District of Columbia, while retail trade, which decreased 14.7 percent nationally, offset increases in other industries.