

Valorie Rice, Senior Business Information Specialist
Current data releases as of 15 April 2022
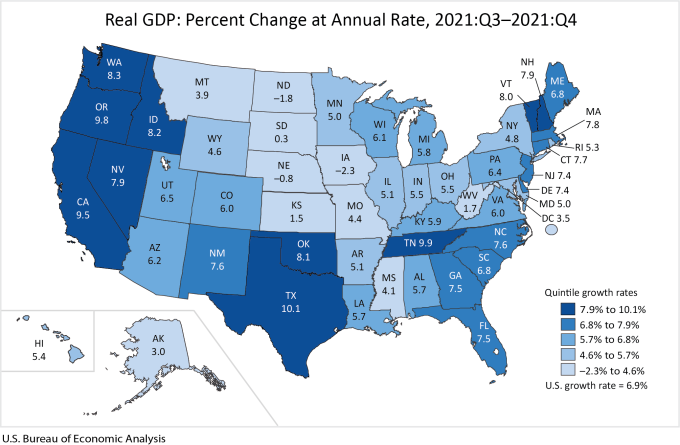
Real GDP by state increased at an annual rate of 6.2 percent in Arizona during the fourth quarter 2021. Real GDP increased in 47 states and the District of Columbia according to the March 31 U.S. Bureau of Economic Analysis release. The U.S. growth rate was 6.9 percent for the quarter. Texas had the largest increase at 10.1 percent. Several western states did particularly well, with Oregon (9.8 percent), California (9.5 percent), Washington (8.3 percent), Idaho (8.2 percent) and Nevada (7.9 percent) among the top ten states for GDP increases over the quarter. Three states had decreases in real GDP, Iowa (-2.3 percent), North Dakota (-1.8 percent), and Nebraska (-0.8).
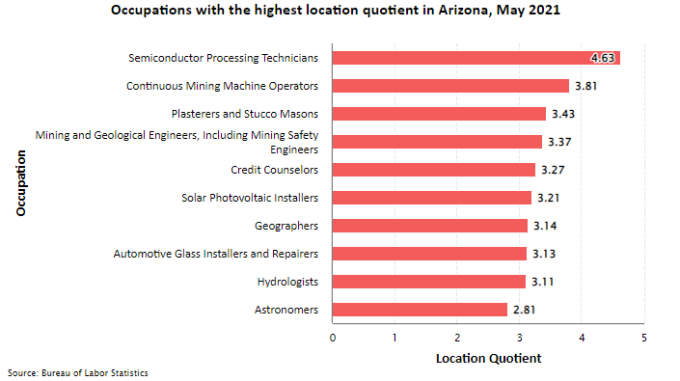
The top five largest occupations by employment in the U.S. for 2021 were retail salespersons, home health and personal care aides, cashiers, fast food and counter workers, and registered nurses based on the Occupational Employment and Wages Statistics release on March 31. The top five occupations in Arizona had similarities though the order was a bit different. Customer service representatives was the largest occupation by employment in Arizona though it ranked seventh in the U.S. The second highest occupation in Arizona was retail salespersons (first nationally) followed by general and operations managers, home health and personal care aides, and cashiers. Registered nurses were the seventh largest occupation in Arizona and fast food and counter workers were ninth. Occupations that were most concentrated in Arizona compared to the nation in 2021 were semiconductor processing technicians with a location quotient of 4.63 followed by continuous mining machine operators at 3.81. A location quotient larger than 1.00 indicates an industry with a greater share of employment than what is found nationally.
January marked the 32nd consecutive month that Phoenix house price increases topped the S&P CoreLogic Case-Shiller Indices according to the March 29 release. The 12-month price increase for Phoenix in January was 32.6 percent followed by 30.8 percent in Tampa. Nationally, house prices rose 19.2 percent in January compared to 18.9 percent the month before. The 20-city composite index increased 19.1 percent over the year with price increases ranging from 32.6 percent in Phoenix to 11.2 percent in Washington D.C.
Arizona continues to post fewer bankruptcy filings than previous years. There were 780 new filings in the state during March, a decrease of 16.6 percent from the year before and the lowest March figure since 2007. Only Chapter 13 (individual debt adjustment) had more filings for the month compared to a year ago and that was very slight increase of 0.5 percent. Year-to-date, bankruptcy filings were down 16.5 percent for the state, -17.7 percent for the Phoenix office, -8.4 percent for the Tucson office, and -34.8 percent for the Yuma office. The Phoenix office includes Apache, Coconino, Gila, Maricopa, Navajo, and Yavapai counties. The Tucson office oversees Cochise, Graham, Greenlee, Pima, Pinal, and Santa Cruz counties, while the Yuma office represents La Paz, Mohave, and Yuma counties.
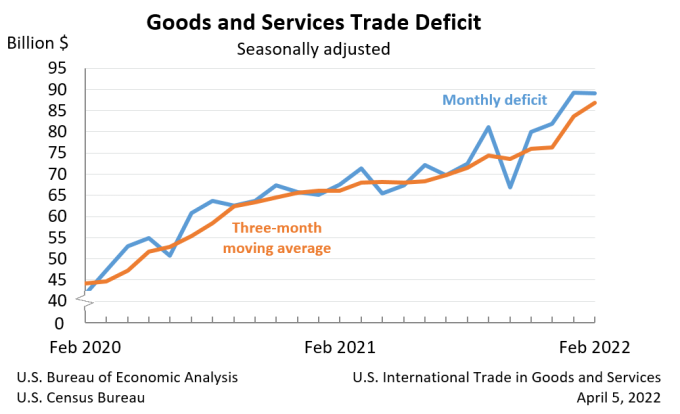
The U.S. trade deficit was steady between January and February, moving down less than $0.1 billion from the revised January figure of $89.2 billion to $89.2 billion in February. Both exports and imports rose over the month, with exports rising $4.1 billion to $228.6 billion and imports rising $4.1 billion to $317.8 billion. Year-to-date, the deficit of goods and services was 34.5 percent higher than the same period a year ago. Exports were up 17.6 percent year-to-date and imports up 22.0 percent according to the joint U.S. Census Bureau and U.S. Bureau of Economic Analysis April 5 release.
The U.S. inflation rate increased 8.5 percent in March. This was the largest 12-month change in the Consumer Price Index (CPI) since December 1981 according to the April 12 release from the U.S. Bureau of Labor Statistics. The year-over-year change in consumer prices was led by energy costs, as was the month-over-month change. The CPI increased 1.2 percent over the month in March on a seasonally adjusted basis, driven primarily by gasoline prices which increased 18.3 percent. Shelter and food also contributed to the increase over the month. The March index for all items less food and energy rose 0.3 percent.
Use your cursor as a tooltip to switch series ON/OFF at the bottom of the chart. Run your cursor over the chart to view values.
Seasonally adjusted producer prices rose 1.4 percent over the month in March based on data released by the U.S. Bureau of Labor Statistics on April 13. The index for final demand goods increased 2.3 percent while final demand services increased 0.9 percent. The 12-month change in Producer Price Index for final demand rose 11.2 percent on an unadjusted basis, the largest one-year change since it was first calculated in November 2010.
Nonfarm employment in Arizona was up 3.7 percent over the year in March, according to the Arizona Office of Economic Opportunity April 14 release. Over-the-year employment increases for Arizona metropolitan areas were 10.2 percent in Flagstaff, 3.7 percent in Phoenix, 3.7 percent in Prescott, 3.5 percent in Tucson, 3.2 percent in Lake Havasu City-Kingman, 2.8 percent in Yuma, and 1.5 percent in Sierra Vista-Douglas. Leisure and hospitality followed by trade, transportation and utilities were the sectors with the largest over the year increases in jobs. The only sector with a decrease in employment from March to March was financial activities, which lost 1,700 jobs. Arizona’s seasonally adjusted unemployment rate was 3.3 percent in March, the lowest on record (series began in 1976). Unemployment rates for Arizona counties ranged from a low of 2.3 percent in Greenlee to 13.7 percent in Yuma in March.
There were a dozen states that set new record lows for unemployment in March, Arizona among them. All state series began in 1976 based on the April 15 state employment report from the U.S. Bureau of Labor Statistics. States posting the lowest jobless rates on record for the month were Nebraska, Utah, Indiana, Montana, Alaska, Arizona, Georgia, Idaho, Mississippi, Tennessee, West Virgina, and Wisconsin. Nebraska and Utah had the lowest unemployment rates for the U.S. at 2.0 percent each. Arizona’s seasonally adjusted jobless rate of 3.3 percent was lower than the U.S. rate of 3.6 percent. The highest unemployment in March was in the District of Columbia with a 6.0 percent unemployment rate followed by 5.3 percent for New Mexico.


