
Slow First Quarter for Arizona; Aging Trends Persist
By: EBRC Research Staff
Current data as of 25 June 2026
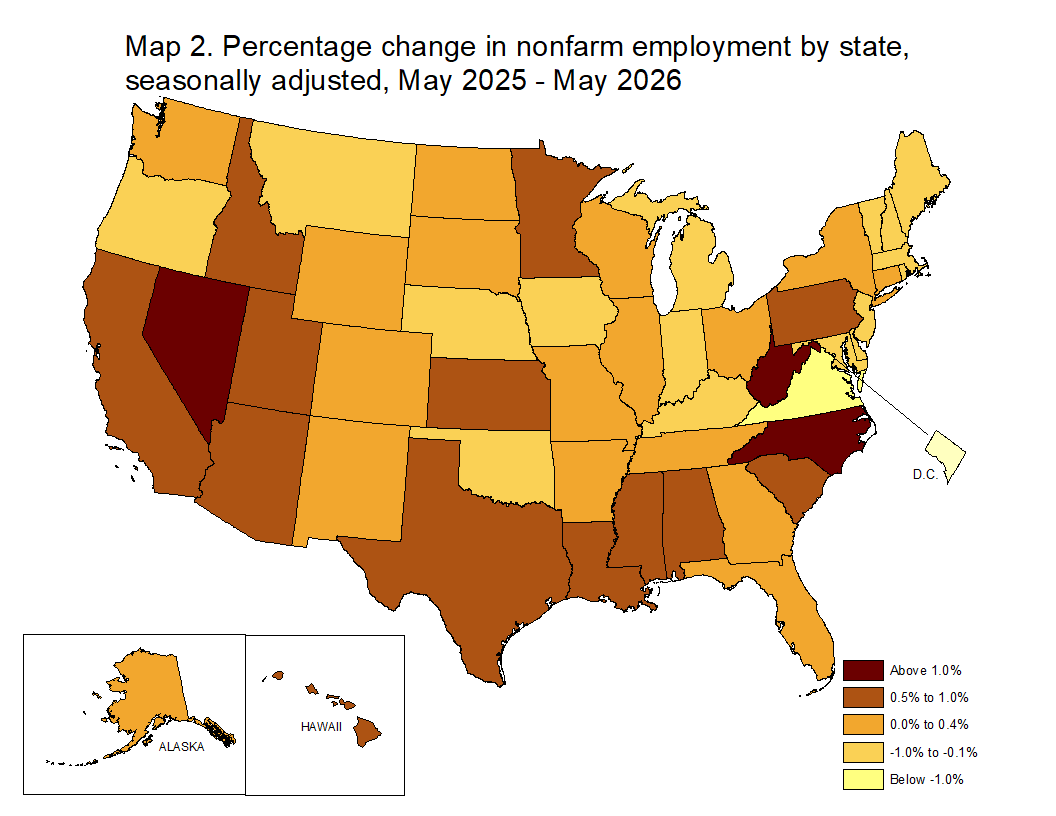
Month-over-month state unemployment rates were lower in 6 states, higher in 2 states, and stable in the remaining 42 states and the District of Columbia. Arizona’s seasonally adjusted unemployment rate edged up month-over-month to 4.8%, while the nation held at 4.3%. Please see our previous article for more details on Arizona’s employment situation. South Dakota had the lowest jobless rate in April at 2.1%, while the District of Columbia had the highest rate at 6.1%, followed by California at 5.3%. Sixteen states had unemployment rate increases year over year, the largest of which were in Connecticut (+1.3 percentage points) and Florida (+1.1 percentage points). Six states had year-over-year rate decreases, the largest of which was in Ohio (-1.0 percentage points). – Niaoniao You
May building permits for Arizona totaled 2,961, 34.4% lower than the same month a year ago on an unadjusted basis. Over the year, single-family permits fell 21.6% to 2,537. The Phoenix-Mesa-Chandler metropolitan area recorded 2,255 total and 1,895 single-family permits for May, down 35.0% and 16.3% over the year, respectively. Likewise, the Tucson metropolitan area posted declines in building permits over the year with total permits at 319, a 21.4% drop, and single-family permits at 275, a 21.9% decrease. Yuma was the only county that had a higher number of single-family building permits compared to the same month last year. Coconino county had no change, and all others recorded declines. – Niaoniao You
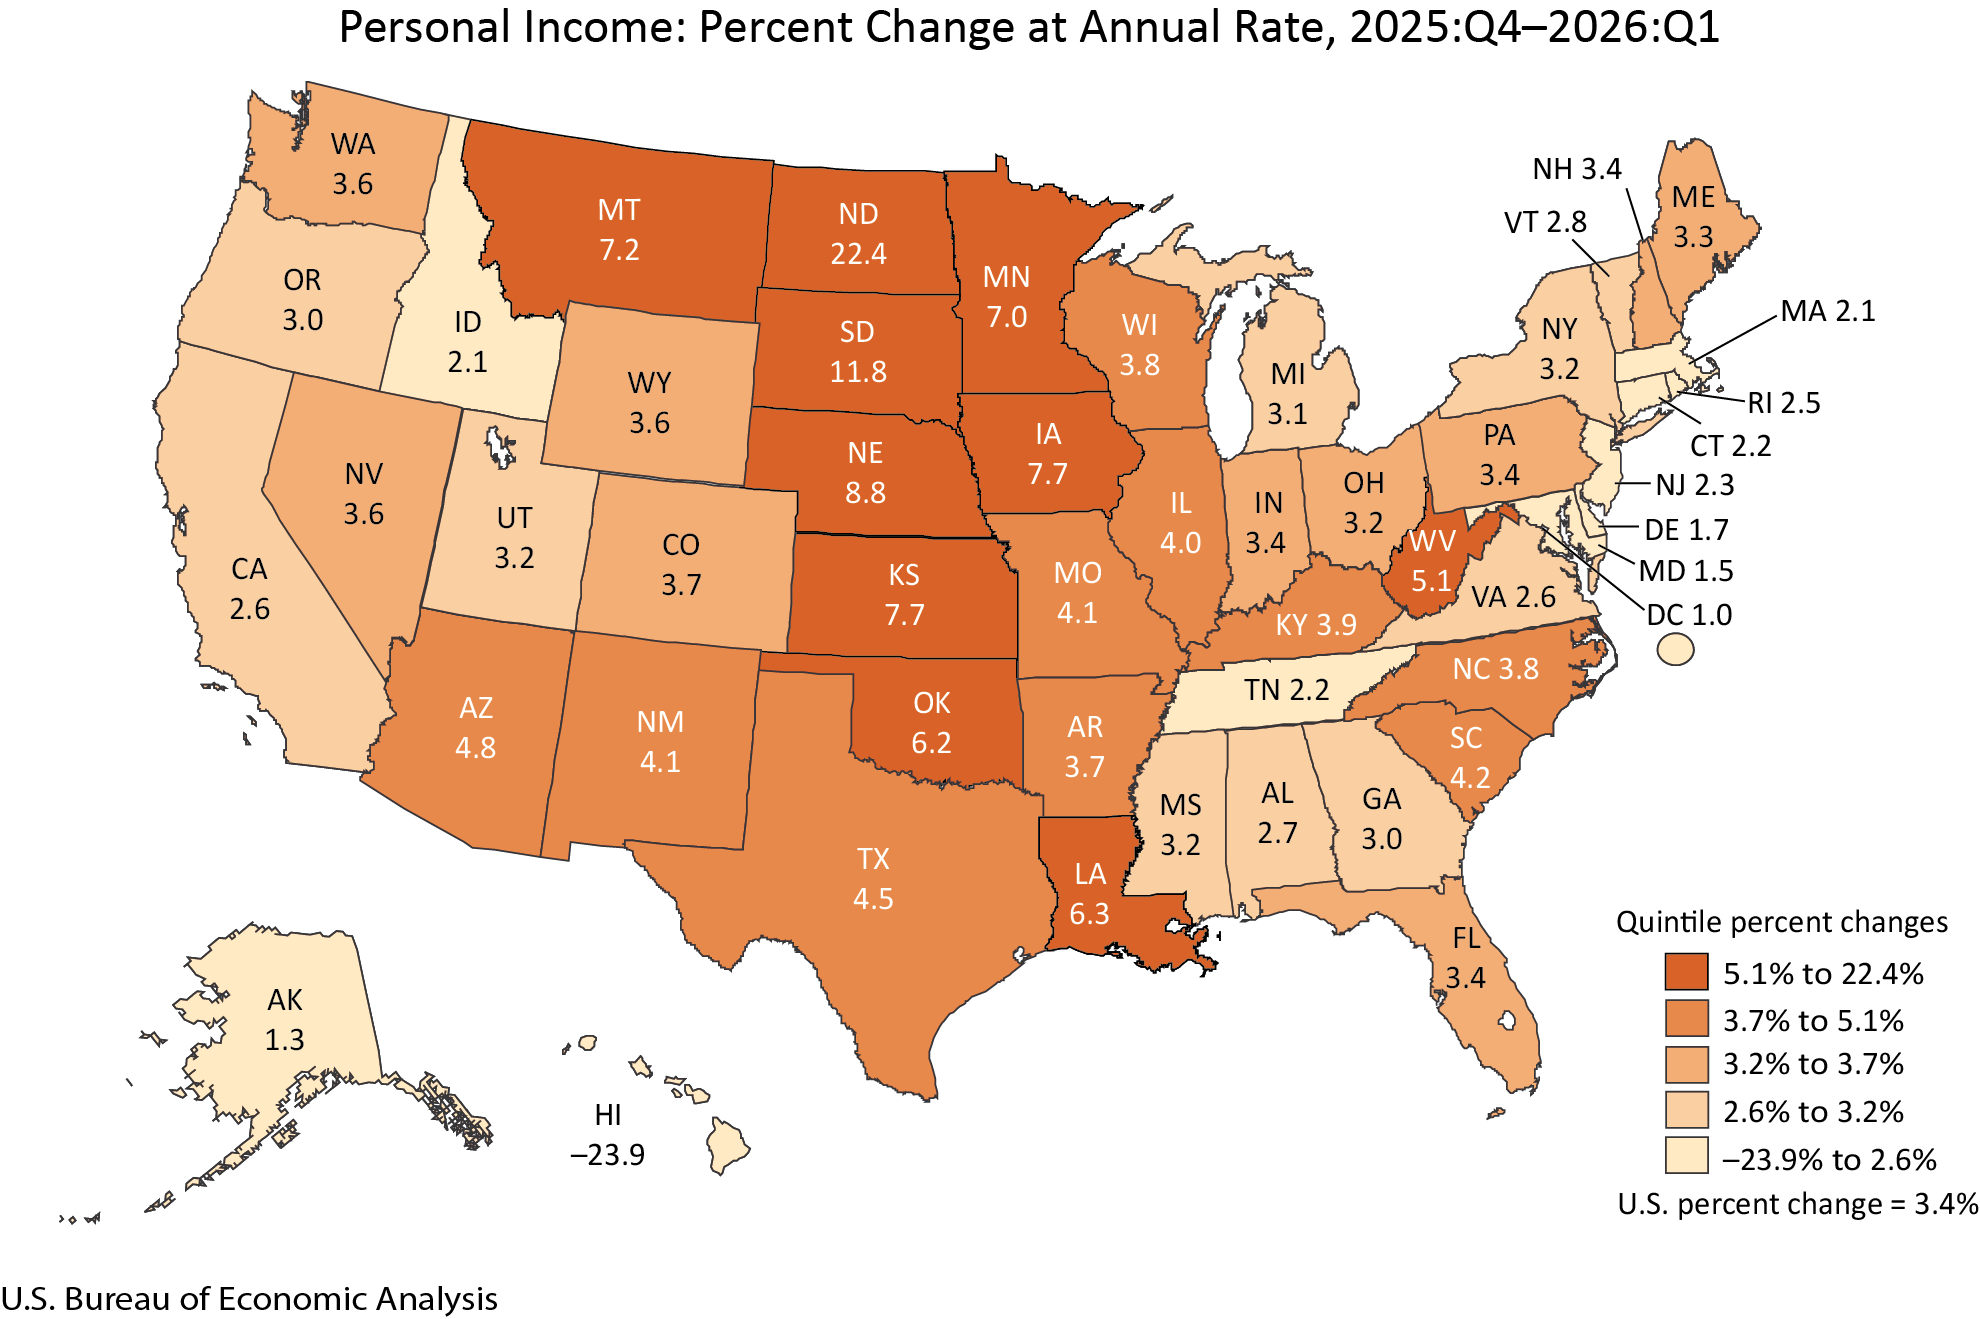
In the first quarter, Arizona personal income increased 4.8% at an annual rate, with net earnings from work (wages and salaries, proprietor’s income, fringe benefits) rising 2.0% at an annual rate, below the national pace of 3.1%. For Arizona, that was a slowdown from the 3.3% annualized growth in the last quarter of 2025 but an acceleration from 0.3% a year ago. Income from dividends, interest, and rent rose 5.1%, above the national pace at 4.2%. Transfer receipts (Social Security, Medicare, Medicaid, welfare, etc.) rose 12.4% in Arizona and 3.7% nationally.
Arizona’s per capita personal income in the first quarter hit $69,728 at the seasonally adjusted annual level, 89.6% of the national average of $77,816. It grew 3.7% from the prior quarter, slightly above the U.S. pace of 3.4%. Arizona ranked 36th in the nation in 2025 (including D.C.), down from 33rd in 2024. In percentage terms, the state’s per capita personal income was 89.4% of the national average in 2025 and 90.2% in 2024.1 –Niaoniao You
1 These estimates are based on population data from the U.S. Census Bureau, not the Arizona Office of Economic Opportunity.
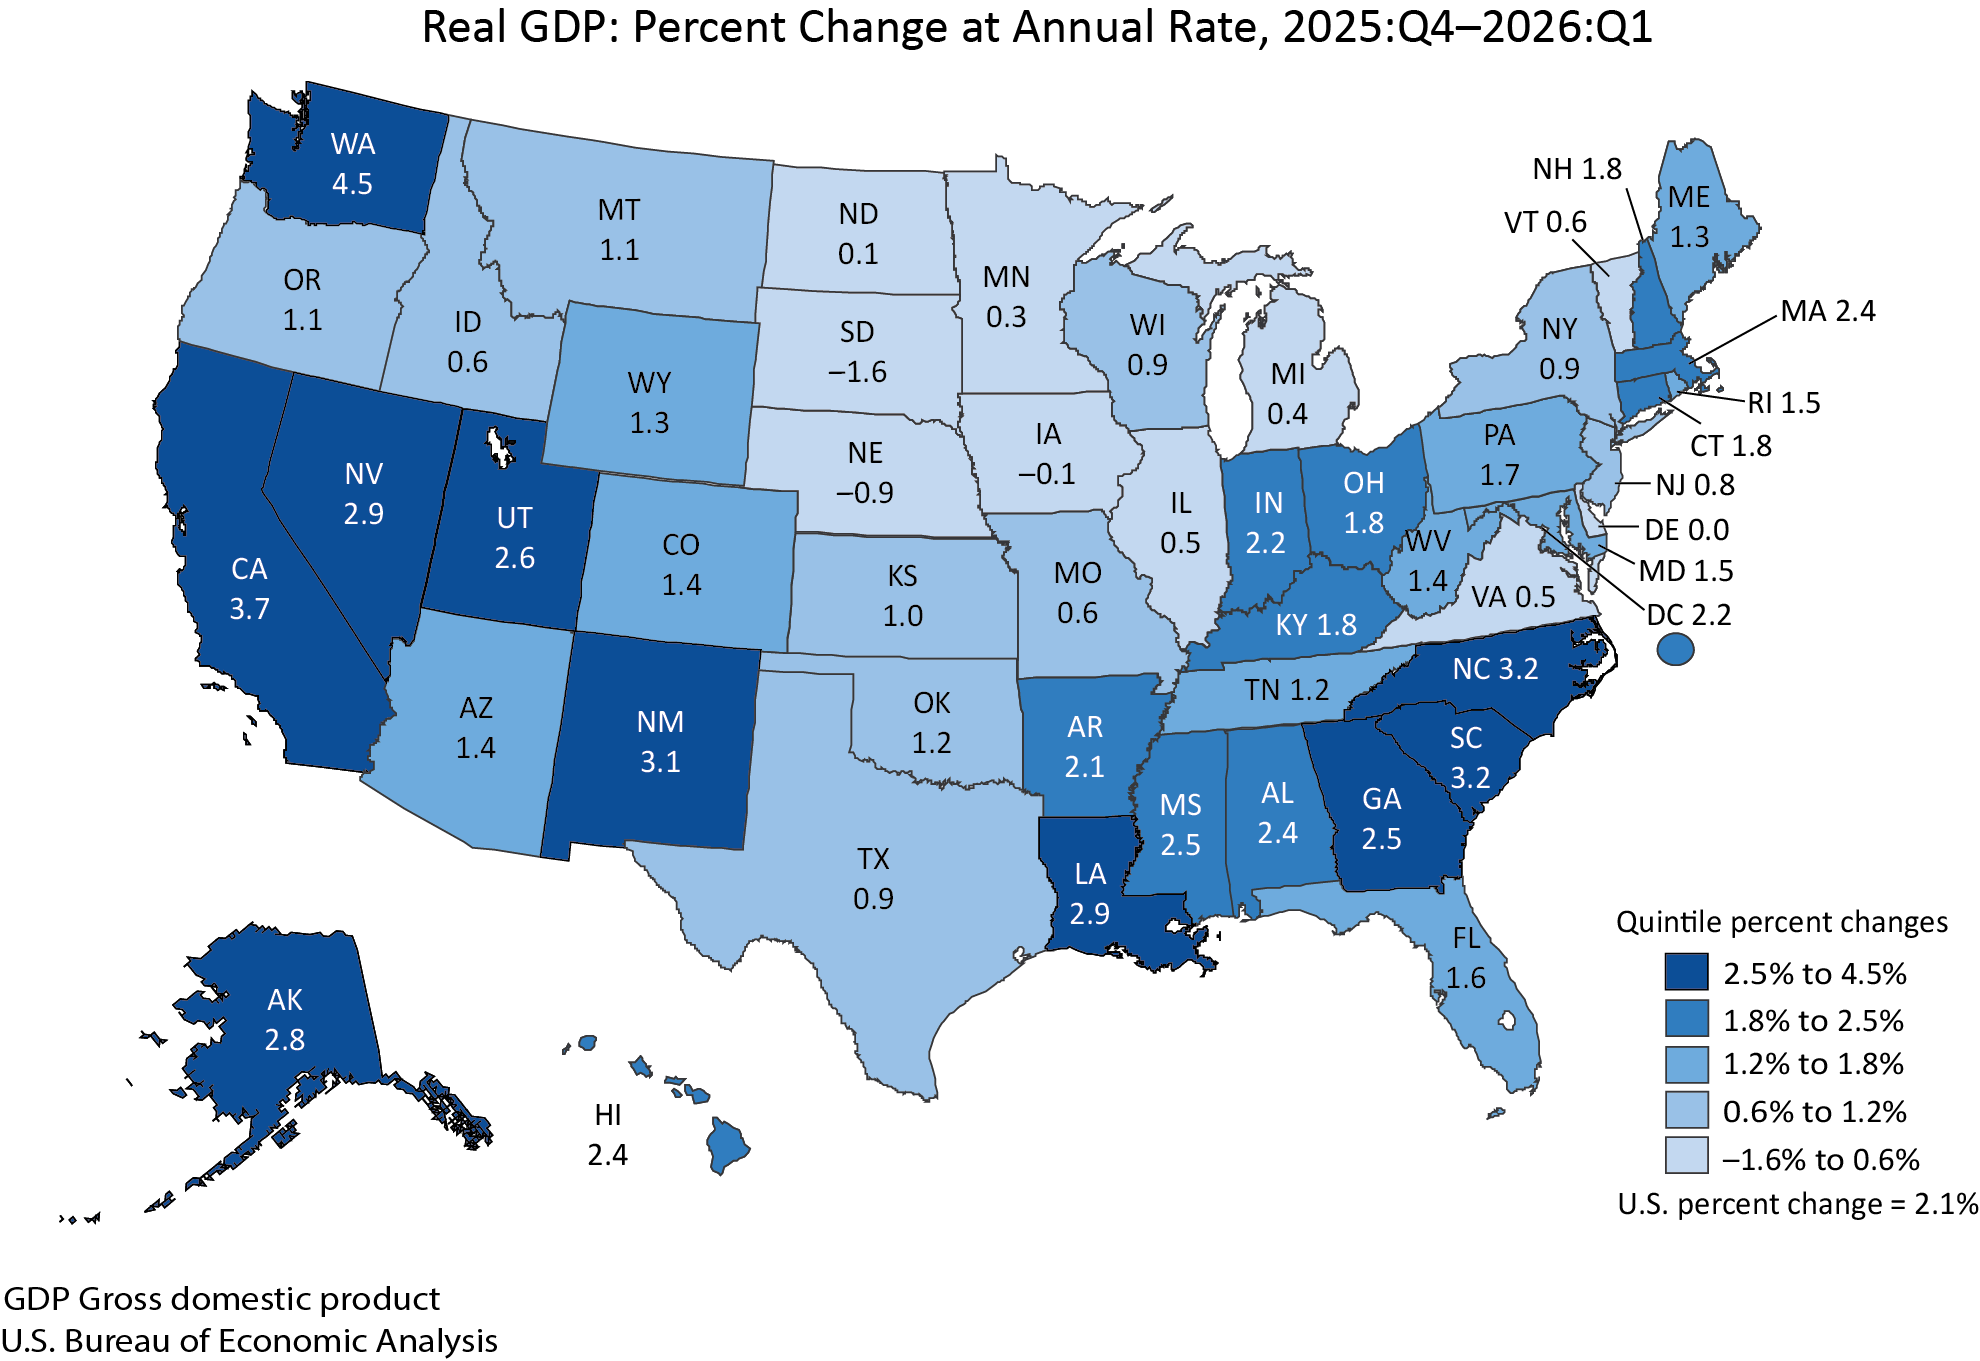
Arizona real GDP rose by 1.4% at an annual rate in the first quarter of 2026, compared to the U.S. at 2.1%. Growth slowed from 1.5% in the prior quarter but rebounded from -3.8% in the same quarter a year ago. Nationally, real GDP increased in 46 states and the District of Columbia, decreased in South Dakota, and was unchanged in Delaware.
Sectors generating the fastest growth in Arizona last quarter were manufacturing; information; government; professional and business services; private education and health services; and natural resources and mining. Real GDP was down last quarter in trade, transportation, and utilities; finance, insurance, and real estate; construction; leisure and hospitality; and other services. –Niaoniao You
Finally, the U.S. Census Bureau released 2025 population estimates by age, sex, race, and Hispanic origin for the nation, states, metropolitan areas, and counties. Arizona’s median age in 2025 was the same as the nation’s at 39.4, up from 38.7 in 2020 (U.S. median age in 2020 was 38.6). Maine had the highest median age (44.9), while Utah had the lowest (32.6). There was definite regional variation in population growth, with the South growing faster than all other areas of the country in every age group. The South was the only region reporting growth in all five major age groups (under 18, 18-24, 25-44, 45-64, and 65 and older) between 2020 and 2025. It was also the only region to have growth for those under 18 (1.1%). All other regions experienced a decrease in the under-18 age group, with the West registering the largest decrease at -5.7%. Nationally, the under 18 population declined by 2.4% between 2020 and 2025. The fastest-growing age group was those aged 65 and older, registering double-digit growth in the U.S. and across all regions of the country. The 65 plus age group increased 17.5% in the South, followed by 16.5% in the West and 16.2% nationally. –Valorie Rice