
The Curious Case of Arizona Jobs: 2023-2025
By George W. Hammond, EBRC research professor
Strange patterns have emerged in one of our most important economic indicators
Each year the U.S. Bureau of Labor Statistics (BLS) revises national, state, and local job and unemployment data for the previous one to two years, with occasional revisions going further back. This process is known as benchmarking. In some years, these revisions are significant. This is one of those years.
The benchmark revisions were particularly striking, and puzzling, for Arizona nonfarm payroll jobs from the Current Employment Statistics (CES) program. These data come from a survey of 11,500 establishments and are benchmarked annually to data from the Quarterly Census of Employment and Wages (QCEW). Benchmark revisions are usually released in March of the year (April for 2026, due to the federal government shutdown last fall) and give us a revised picture of jobs for roughly the past 18 months, with occasional revisions going further into the past.
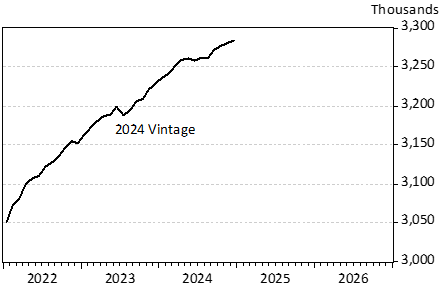
The best way to see what has been happening to our understanding of Arizona jobs is to view the data by vintage. For instance, as of January 2025, Exhibit 1 shows Arizona seasonally-adjusted jobs through December 2024. This looks pretty normal.
Exhibit 1: Arizona Seasonally-Adjusted Nonfarm Payroll Jobs, 2024 Vintage, Thousands
In March 2025, the BLS released revised, benchmarked, nonfarm payroll jobs for Arizona. Let’s call these the 2025 vintage estimates. Exhibit 2 shows both the 2024 and 2025 vintage estimates through December 2024.
Exhibit 2: Arizona Seasonally-Adjusted Nonfarm Payroll Jobs, 2024 and 2025 Vintages, Thousands
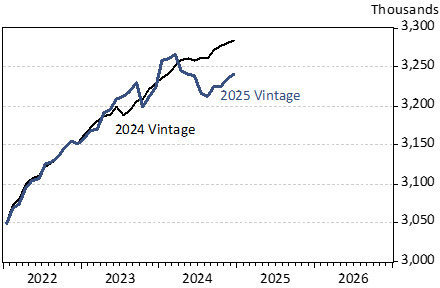
As you can see, the 2025 vintage data looks very different. First, we have a massive 31,100 job drop in October 2023, followed by strong growth through March 2024, then large job losses through August, followed by a rebound. This is a very puzzling result, because the job losses in October 2023 and in 2024 are huge. In fact, the 53,900 job drop from March to August 2024 is large enough that it would generally be considered a recession. For a more detailed analysis see Arizona’s Phantom Recession. In short, these estimates seemed wrong.
This brings us to the latest round of benchmark revisions, released in April 2026. These are labeled 2026 vintage in Exhibit 3. In an unusual step, BLS has revised Arizona nonfarm payroll jobs all the way back to early 2024.
Note that the large job losses during 2024 have been revised away and the 2026 vintage is very close to the 2024 vintage. However, the 2026 vintage data still includes the major drop in October 2023. This does not seem correct or credible. In other words, the decline is in the data but not occur in reality. See more analysis of the October 2023 drop in Arizona’s Phantom Recession.
Exhibit 3: Arizona Seasonally-Adjusted Nonfarm Payroll Jobs, 2024, 2025, and 2026 Vintages, Thousands
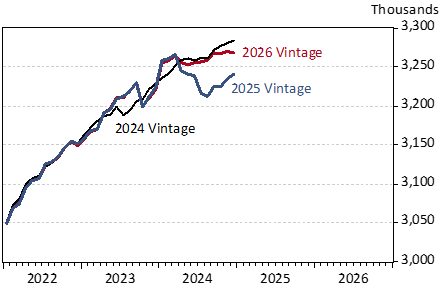
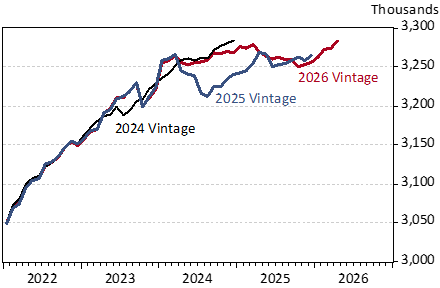
Exhibit 4 shows the 2024, 2025, and 2026 vintages through their entire intervals. Note that we again see job losses beginning in March 2025 that end in the fall of 2025, somewhat similar to the pattern in the 2025 vintage data for 2024. An important question remains: will the weakness in 2025 be revised away in the 2027 vintage benchmark? In other words, will we see weakness in jobs in the spring and summer months every year going forward?
Exhibit 4: Arizona Seasonally-Adjusted Nonfarm Payroll Jobs, 2024, 2025, and 2026 Vintages, Thousands
An additional curiosity in the data on Arizona employment becomes evident when we compare the resident employment from the Local Area Unemployment Statistics (LAUS) program and the jobs data from the Current Employment Statistics (CES) program. As Exhibit 5 shows, these two data sources show opposing trends so far in 2026, with resident employment falling and nonfarm payroll jobs rising.
Exhibit 5: Arizona Resident Employment (Household Survey) and Nonfarm Payroll Jobs (Establishment Survey), Seasonally Adjusted, Thousands
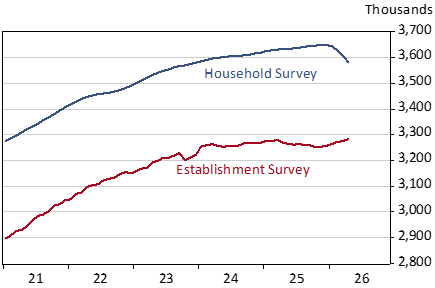
The LAUS data are based on a survey of households and provide a measure of employed residents, no matter where they work. These data include the self-employed, unpaid workers in a family business, and others not included in the CES survey. This survey is small, encompassing roughly 1,500 households in Arizona.
The CES data are based on a survey of establishments and provide a measure of jobs on the payrolls of firms. Jobs are counted based on the location of the establishment, no matter where the workers come from. Since these data count jobs, an employment resident will be counted once for each job they hold, as long as the job is at a different establishment. Thus, a resident with two jobs will be counted twice. This survey is fairly large, encompassing about 11,500 establishments in Arizona.
While trends in these two series occasionally diverge, they generally offer a similar picture of employment in the state. However, due to the larger sample size, we normally place a greater weight on trends in the CES data.