
Arizona’s Economy: Resilient Amid Mixed Signals
Third Quarter 2026 Forecast Update
By Niaoniao You, EBRC Senior Economic Forecaster
August 2026
Arizona’s economy remains resilient as it navigates evolving conditions, but it is increasingly characterized by mixed labor market conditions and slower growth. The labor market improved from dismal job growth in late-2025, but job gains were concentrated in a few sectors as employers stayed cautious about hiring. Elevated gasoline prices due to conflict in the Middle East caught highly automobile-dependent Arizonans off guard. However, retail sales have continued to grow after accounting for inflation, as consumers kept the usual spending patterns. Income gains picked up in the first quarter, but the state’s per capita personal income fell further behind the nation last year. While house price appreciation has moderated, housing cost burdens remain elevated as mortgage rates continue to rise, putting downward pressure on housing permit activity. Overall, the economy kept expanding, but at a slower and more uneven pace than in prior years.
The baseline outlook calls for Arizona’s economy to largely maintain the status quo, with growth picking up slightly in 2026 from the anemic pace of 2025, before gradually returning to a moderate pace in the long run. Elevated price levels across the broad economy and slow hiring weigh on the economy in the near term. Job growth over the next decade is expected to be half of the average pace during the prior decade. Uncertainties surrounding international trade, immigration policy, and AI are also behind much of the sluggish growth. While the baseline forecast calls for continued job growth, the pessimistic scenario (assigned a 25% probability) warns of modest job losses this year and slow gains in 2027.
In the long term, the baseline 30-year forecast calls for the state to grow at a much slower pace than over the past three decades. Still, Arizona’s growth is expected to continue outpacing national growth. The slowing is driven in large part by demographic forces, including precipitously falling birth rates, the retiring baby boom generation, and slowing net migration due to a shrinking advantage in affordability relative to other states. These forecasts assume no substantial impact from major reductions in water deliveries from the Central Arizona Project.
Arizona Recent Developments
In the first half of 2026, Arizona’s labor market recovered from job losses at the end of 2025 but still showed mixed signals. The seasonally-adjusted number of nonfarm payroll jobs in June increased by 23,600, or 0.7% over the year, compared to flat job growth nationally. However, the unemployment rate edged higher to 4.9% in June from 4.8% in May, reaching the highest level in five years. In contrast, the U.S. unemployment rate during the same month edged down to 4.2% from 4.3%, helped by a smaller labor force.
Both the rise in Arizona unemployment rate and the decrease in U.S. unemployment rate need to be interpreted with a grain of salt. First, the gap between the state and U.S. unemployment rates needs to be more than 1.0 percentage point to be statistically significant. Even though the sampling design tries to maximally leverage the small sample size, the Arizona household employment survey relies on fewer than 2,000 households, making the unemployment rate highly volatile. Second, the recent decline in the U.S. unemployment rate is not entirely a positive sign because it is likely due to discouraged job seekers leaving the labor force altogether.
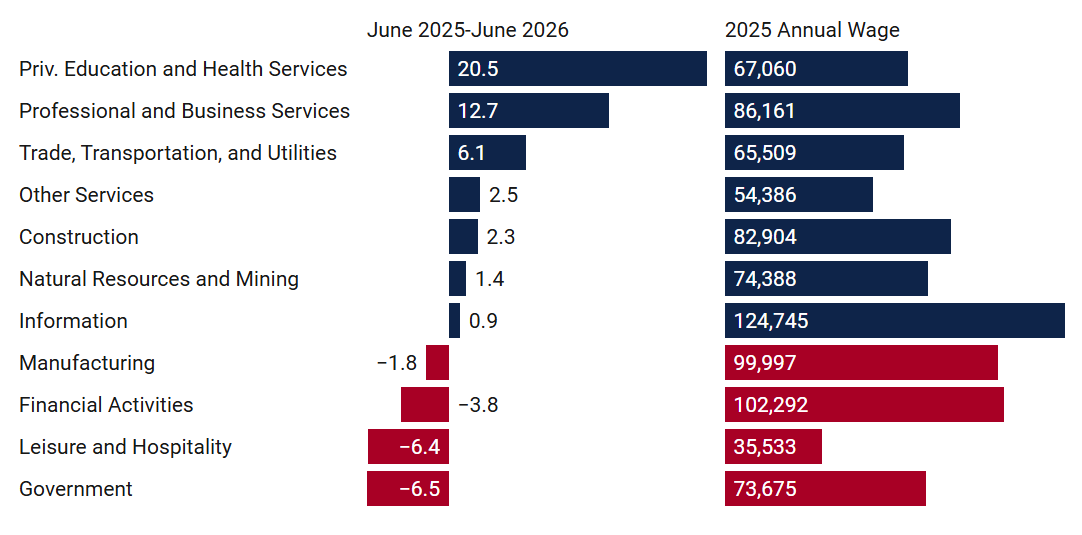
Arizona’s payroll employment numbers have been volatile too. Over the year, Arizona’s non-seasonally-adjusted nonfarm employment increased by 27,900, or 0.9%, in June. Exhibit 1 shows Arizona net job changes by industry. Private education and health services, and professional and business services sectors led job gains, along with trade, transportation, and utilities; other services; construction; natural resources and mining; and information. Those gains were partly offset by job losses in government, leisure and hospitality, financial activities, and manufacturing.
Exhibit 1: Arizona Net Job Changes (Thousands) and 2025 Annual Wages per Worker
Inflation eased late in the summer. The Phoenix MSA CPI for All Items increased 2.8% over the year in June, down from 3.0% in April and below the national pace of 3.5%. Phoenix consumer commodities prices (tangible goods, including food and energy) were up 5.0% over the year, while services prices increased 1.8%. Excluding food and energy, Phoenix core prices were up 2.0% in June, compared to 1.7% in April, well below the national pace of 2.6%, due largely to slower shelter price growth (1.4% in the Phoenix MSA compared to 3.3% nationally).
The Phoenix regular gasoline average price has stayed above $4 per gallon since March after peaking at a monthly average of $4.85 in April. It was still up 23.9% over the year in July. Although it remained well below its recent peak of $5.67 per gallon in June 2022, a prolonged period of elevated gas prices may change consumers’ spending calculations and squeeze budgets for discretionary purchases.
Like the labor market, more comprehensive growth and income data showed resilience in the Arizona economy early this year. Arizona real GDP rose by 1.4% over the quarter at a seasonally-adjusted annual rate in the first quarter of 2026, compared with 2.1% for the U.S. This growth rate ranked 26th in the nation (including D.C.), similar to West Virginia and Colorado. In the first quarter, growth was concentrated in sectors where Arizona has a smaller footprint compared to the U.S. economy, such as manufacturing; government; professional and business services; and natural resources and mining. Meanwhile, the relatively more dominant sectors for Arizona, including financial activities; trade, transportation, and utilities; and leisure and hospitality, experienced declines. Besides, growth in private education and health services was not high enough to pull Arizona’s growth ahead of the national average.
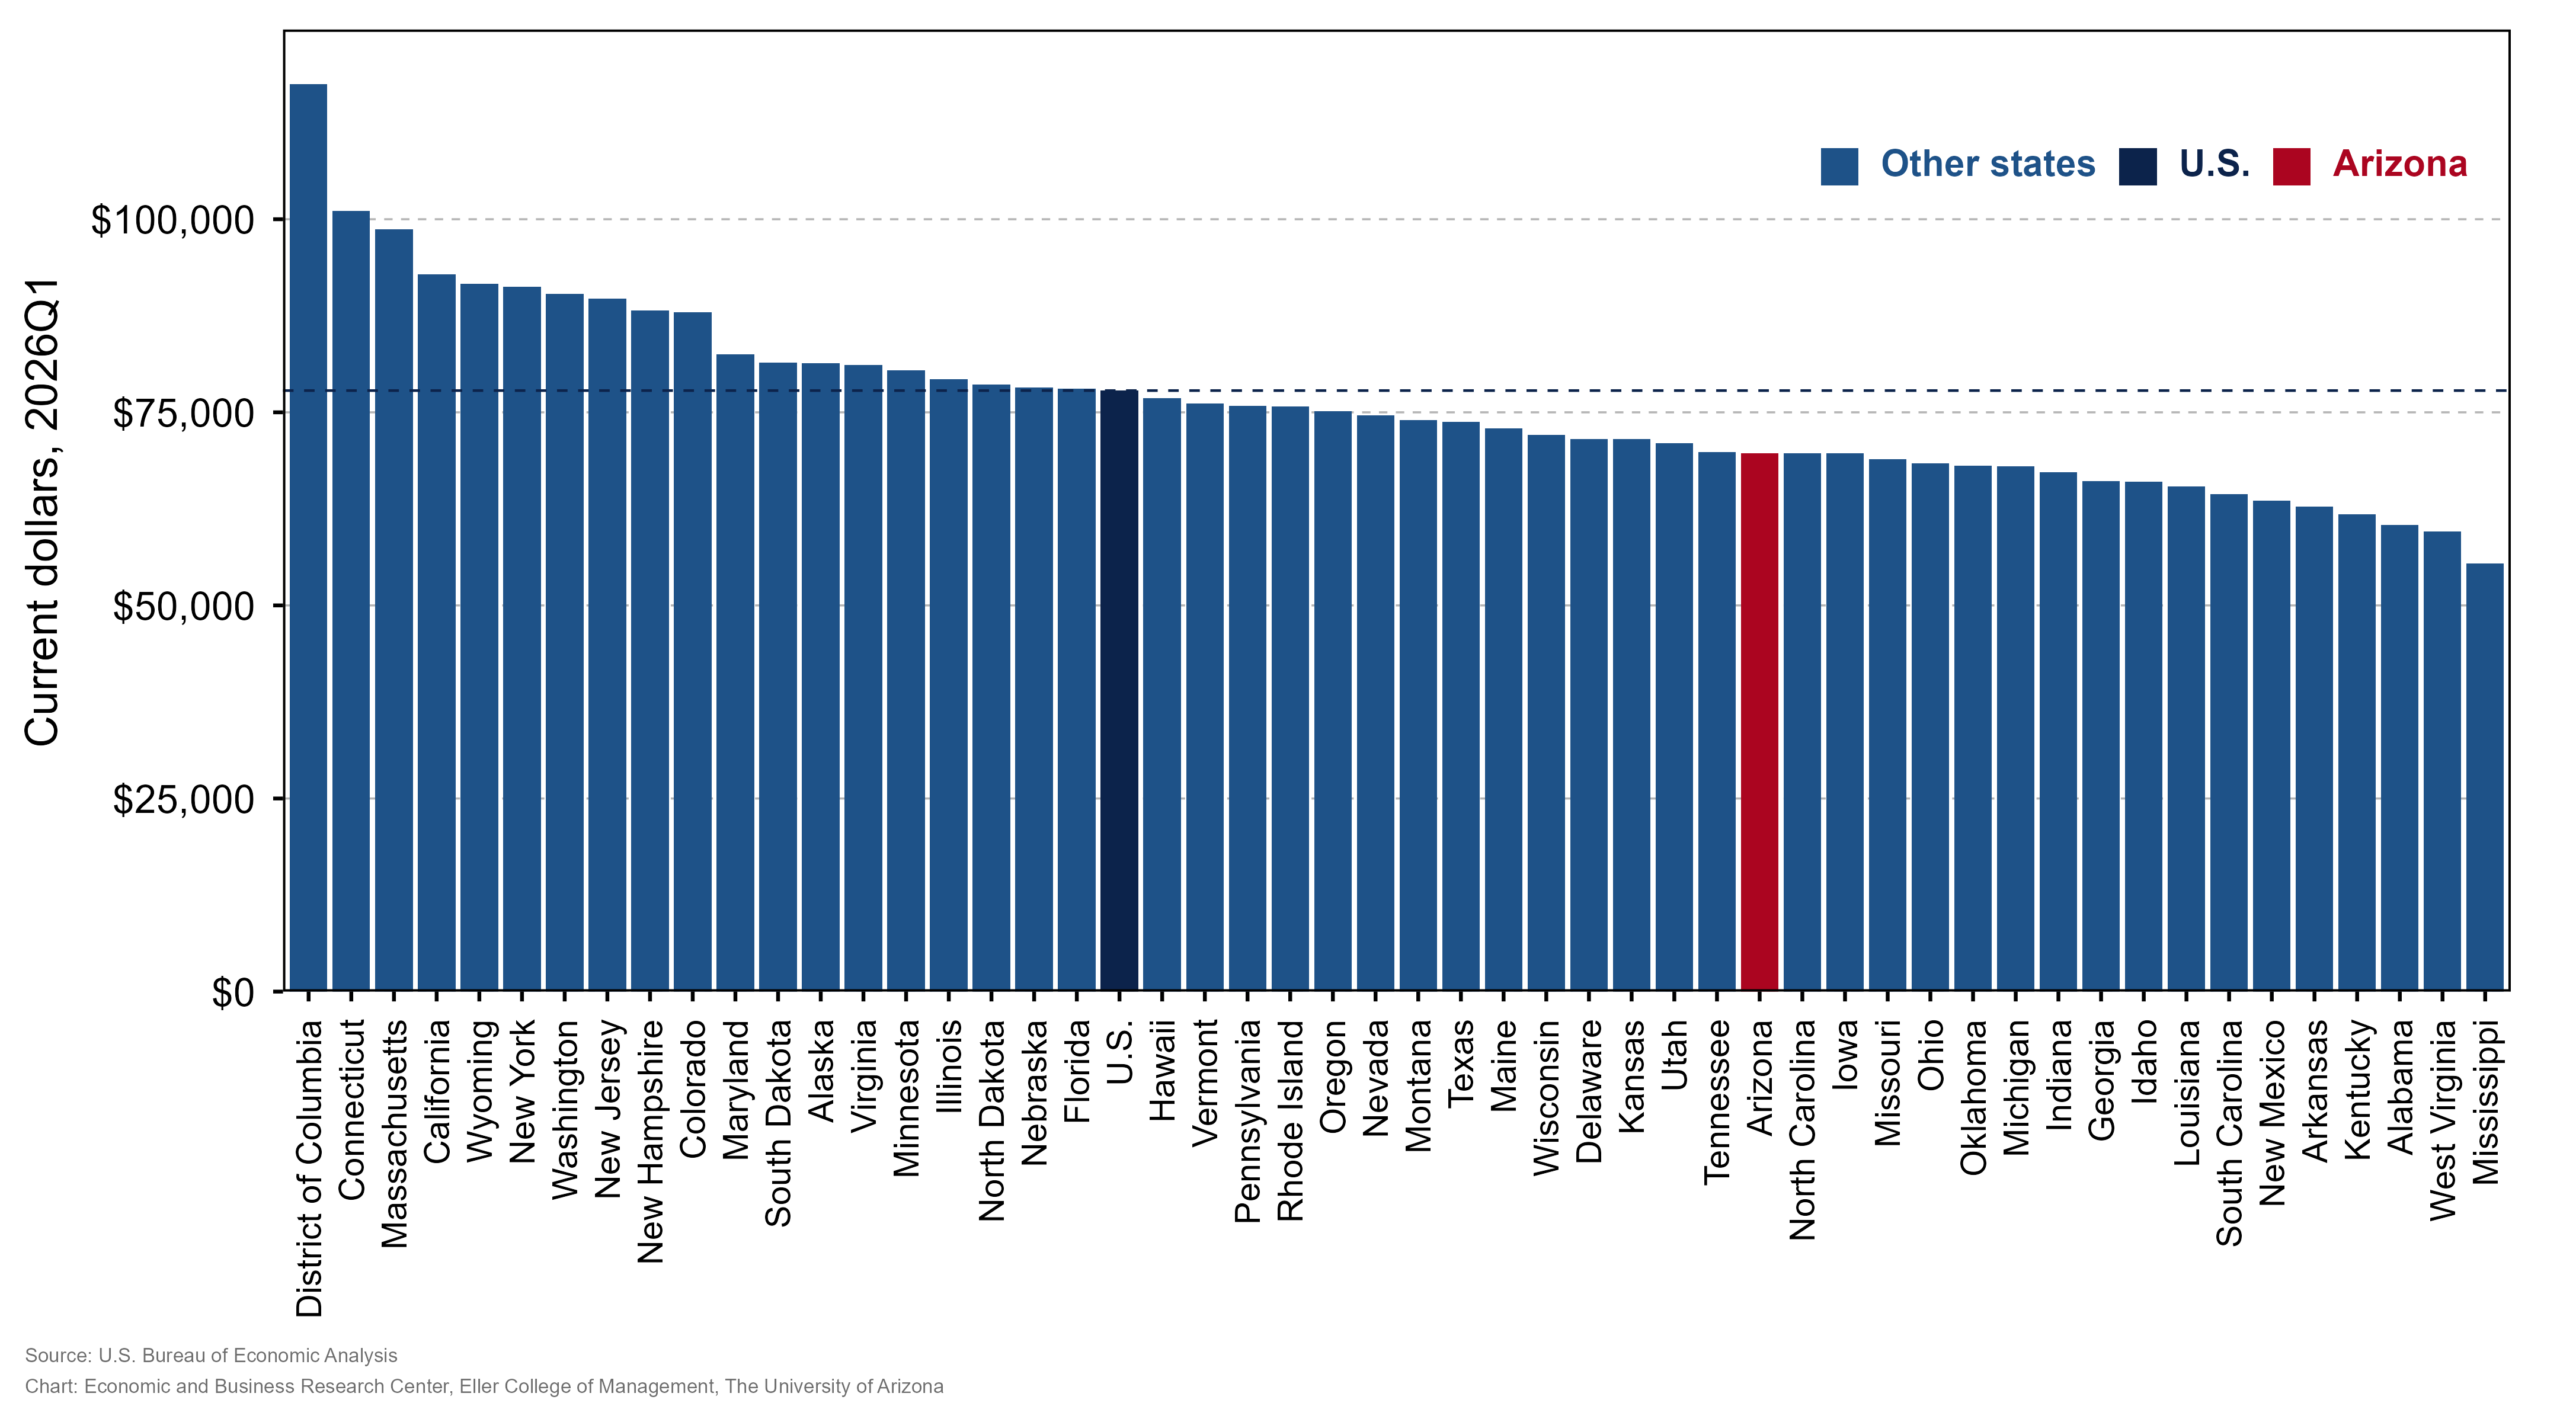
On the other hand, Arizona personal income increased 4.8% at an annual rate in the first quarter, well above the national pace of 3.4%. However, this is mostly boosted by income outside of work, from transfer receipts and dividends, interest, and rent. Arizona’s per capita personal income in the first quarter hit $69,728 at the seasonally adjusted annual level, which was 89.6% of the national average of $77,816. It grew 3.7% from the prior quarter, slightly above the U.S. pace of 3.4%, moving the state ranking up two places to 34th in the nation (Exhibit 2). After adjusting for regional cost of living using the latest release for 2024, Arizona’s real per capita personal income would rank 43rd nationally, but the ranking is subject to high volatility in regional prices.
Exhibit 2: State and National Per Capita Personal Income, Current Dollars, 2026Q1
Housing activities remained subdued in the first six months of 2026, with housing permits in Arizona, Phoenix, and Tucson falling closer to pre-pandemic levels. Total building permits for the state were 17.5% lower over the year from January to June, despite a 6.3% over-the-year uptick in June (4,840 units). Single-family permits issued in the state fell 14.7% over the year in the first half of 2026; multi-family permits plunged 24.5%. House price appreciation in Arizona has moderated significantly, with median single-family house prices hovering around $450,000 since the fourth quarter of 2025 in the Phoenix MSA and around $360,000 since 2024 in the Tucson MSA. Despite the moderation in house price appreciation, housing cost burdens remain significantly elevated.
Taxable sales stayed robust in the second quarter. Arizona taxable sales for retail plus remote sellers rose 3.0% over the year in the first five months of 2026. Phoenix MSA sales rose faster over the year, at 3.6%, while Tucson MSA sales increased 1.5% and Prescott MSA sales increased 1.8%.
Arizona Outlook
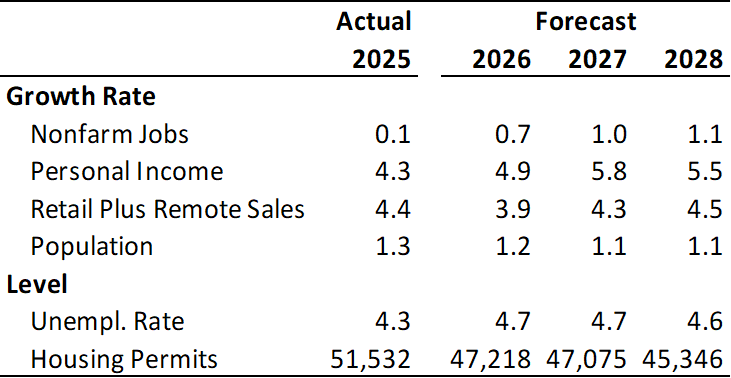
As the U.S. economy continues to grow, the baseline forecast calls for Arizona income and job growth to accelerate modestly in the next year (Exhibit 3). Arizona nonfarm job growth is expected to accelerate modestly in 2026, to 0.7%, and again next year to 1.0%. These growth rates are slow by the state’s historical standards, comparable to the pace of the slow recovery from the Great Recession. The state unemployment rate is forecast to tick up in 2026–2027 and then stabilize at a lower level.
Exhibit 3: Arizona Short-Run Outlook, Annual Growth Rates
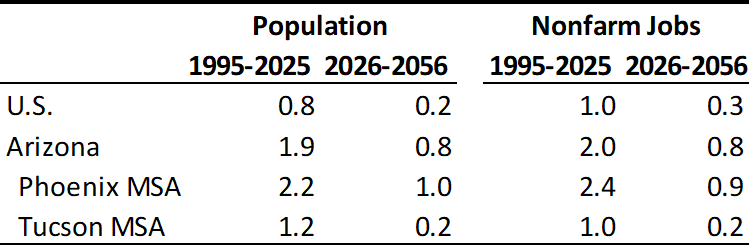
The long-term outlook for Arizona, Phoenix, and Tucson calls for continued growth that outpaces the U.S. but falls far short of rates during the prior thirty years (Exhibit 4). Arizona is projected to add 2.2 million residents during the 2026-2056 period, which translates to an average annual growth rate of 0.8%. Although Arizona’s annual population growth is expected to fall far short of its 1.9% per year pace during the 1995-2025 period, it dwarfs the 0.2% per year pace for the U.S. population.
Along with slowing population growth, the state is forecast to generate positive yet gradually decelerating job growth. With growth in jobs, Arizona real per capita personal income continues to rise during the forecast, but at a pace slightly below the U.S. After adjusting for inflation, Arizona per capita personal income increases 1.6% per year during the next 30 years, which is below the expected national pace of 1.9% per year. That implies that the state falls a bit further behind the nation in per capita personal income.
Exhibit 4: Job and Population Annual Growth Rates, History and Forecast
One reason for the state’s slowing population growth is declining natural increase (the annual difference between births and deaths). The state’s natural increase is expected to turn to natural decrease (more deaths than births each year) in the mid-2030s. The driving demographic trends causing this are the aging of the baby boom generation and birth rates that have fallen significantly since 2007. This trend in natural increase means that, eventually, net migration will not just be the main source of population growth for the state, it will be the only source.
Over the next 30 years, growth in the Phoenix MSA is forecast to outpace gains in the Tucson MSA. That continues the same pattern of the last 30 years for jobs and population.
Risks to the Outlook
The baseline (most likely) forecast calls for the U.S. economy to continue growing in the near term, which sets the Arizona economy up to do the same. However, this momentum hinges on uncertainties to the outlook, notably the development of conflicts in the Middle East, performance of equity markets, tailwinds from the current AI build-out, and upcoming employment data revisions.
In the longer term, risks revolve around the factors that drive long-term growth: demographics (including human capital), private physical capital investment (buildings, machinery), public capital investment (highways, roads, water, sewer, ports), and resource availability (water).
Water is a key resource and a key concern at the moment. How water is allocated along the Colorado River, the sustainability of alternative water sources, and the price at which water is available are among the most important concerns for Arizona’s future. The long-term forecasts summarized here assume that water is not a significant constraint on job and population growth, which is highly uncertain and hinges on climate change, as well as technological and economic innovations.
Arizona’s population is going through a demographic transition as birth rates fall and the baby boom generation ages, putting downward pressure on natural increase (births minus deaths). If natural increase declines faster than expected, or net migration turns out to be slower than expected, Arizona’s population growth will fall below forecast. This, in turn, would mean slower labor force and job growth, as well as even fewer housing permits. Moreover, mass deportations and restricted immigration will contribute to slower population and labor force growth. The more strictly these policies are pursued, the greater the risk to potential growth.
Human capital (the health and educational attainment of the state’s population) also matters for growth, especially as population gains slow. Educational attainment, particularly the share of the population with a bachelor’s degree or better, is a key driver of state and local innovation and productivity growth, requiring significant investment at the state and local level.
Innovation is the main source of improvement in our overall standard of living. AI and automation will be one major way that households and firms experience economic innovation in the coming years. On one hand, AI can help stimulate improvements in our average standard of living, in the face of a demographically driven deceleration in labor force growth. On the other hand, it will disrupt the labor market, impacting some industries and occupations more than others.
Employment in a few large sectors highly concentrated in Arizona, including professional and business services; trade, transportation, and utilities; and financial services, is currently experiencing heightened uncertainty related to the adoption of AI. It is far from clear at this point what the net impact will be on job growth and economic inequality, but the risks are certainly there.
Private physical capital investment will also be a key driver of long-run growth. Maintaining a competitive tax and regulatory climate will be crucial for attracting those investments. The long-term impact of the current AI build-out on subsequent infrastructure investment hinges on the pace of AI development and adoption. Private physical capital investment must be paired with public capital investments in highways, roads, water, sewer, telecommunications, and border port infrastructure.
Finally, tariffs affect the tax and regulatory environment in which firms and consumers operate. It has long been shown by economists that tariffs are a very distortionary way for the federal government to raise revenue.
VIEW MOST RECENT FORECAST DATA FOR ARIZONA, PHOENIX, AND TUCSON
If your business or organization requires more timely and in-depth forecast data and analysis, contact us to find out about the benefits of joining EBRC’s Forecasting Project.
Copyright 2026 Economic and Business Research Center, The University of Arizona, all rights reserved.