

Delaney O’Kray-Murphy, EBRC Research Economist
Valorie Rice, Senior Business Information Specialist
Current data releases as of 1 March 2024
Arizona house prices rose 6.6% between the fourth quarter of 2022 and the fourth quarter of 2023. This was just above the national price change of 6.5%, according to the Federal Housing Finance Agency (FHFA) House Price Index fourth quarter release. New England and Mid Atlantic were the primary regions of the U.S. for housing appreciation during the last quarter of 2023. The top states for one-year house price changes in the fourth quarter of 2023 were Rhode Island (15.1%), Vermont (13.3%), and West Virginia (12.4%), far exceeding the national rate. House prices rose over the year in all states except for Hawaii, which experienced a 3.4% decline in prices. The District of Columbia also had falling house prices at -1.2%. Statistics above reflect the purchase-only index. Data are also available with the all-transactions index (purchase and refinance mortgages) for all metropolitan areas, including smaller metros. Price changes for the U.S. and Arizona were a bit lower using the all-transactions index, at 5.7% and 4.4%, respectively. Arizona metropolitan area one-year price changes in the fourth quarter of 2023 were 7.6% in Flagstaff, 6.4% in Prescott Valley-Prescott, 6.2% in Tucson, 5.7% in Yuma, 4.6% in Sierra Vista-Douglas, 3.7% in Phoenix, and 2.7% in Lake Havasu City-Kingman. – Valorie Rice
FHFA All Transactions House Price Index
Employment increased over the year in 309 of the largest 360 U.S. counties from September 2022 to September 2023, according to the U.S. Bureau of Labor Statistics’ Quarterly Census of Employment and Wages (QCEW) program. In September 2023, employment increased to 153.8 million, a 1.5% increase over the year. Hall, GA, had the largest over-the-year increase, with a gain of 5.4%. Among the 360 largest counties, 169 saw over-the-year increases in average weekly wages. In the third quarter 2023, average weekly wages for the nation increased to $1,334, a 0.1 percentage point gain. Clayton, GA, had the largest over-the-year wage gain at 7.7% while Elkhart, IN, had the biggest drop in wages at -6.0%. Two Arizona counties, Maricopa and Pima, made the list for the top 360 counties. Both counties saw increases in over-the-year employment, with Maricopa and Pima rising by 2.0% and 1.5%, respectively. On the other hand, only Pima County saw wage increases, increasing 0.7% over the year, while Maricopa saw a decrease of 0.9%. — Delaney O’Kray-Murphy
In January, Arizona building permits saw a significant over-the-year increase of 174.3% to 5576, not seasonally adjusted. The number of single-family permits similarly saw notable over-the-year gains, increasing 126.3% from last January. The Phoenix metropolitan area accounted for most of the permits issued in the state, with 4551, a 217.1% increase. The number of single-family permits additionally rose 146.8% to 2720. The Tucson MSA additionally exhibited solid growth, with total permits rising 85.4% to 419. Of the counties, Apache, Graham, Gila, Maricopa, Mohave, Pinal, Yavapai, and Yuma had more permits this January than last, while Cochise, Coconino, Navajo, and Santa Cruz decreased. No changes were observed in La Paz. — Delaney O’Kray-Murphy
Phoenix house prices ended the year with a 3.8% increase over December 2022. Nationally, house prices rose 5.5% over the year in December based on the S&P CoreLogic Case-Shiller Indices released on February 27. The 20-city composite increased by 6.1% over the same period. Of the 20 cities in the index, San Diego posted the largest gain in house prices year-over-year at 8.8%, followed by Los Angeles and Detroit, with an 8.3% increase each. All cities reflected positive annual gains in house prices for December; however, Portland was at the bottom of the list with an increase of just 0.3%. While annual price changes increased across the board, 17 of the 20 cities reported monthly decreases in December, including Phoenix. –Valorie Rice
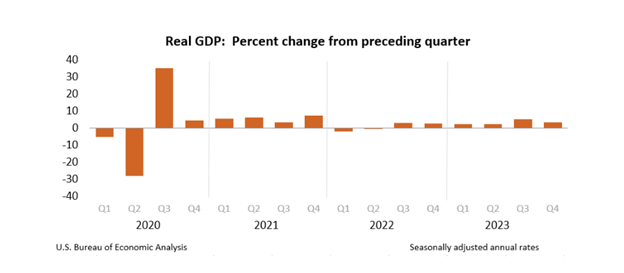
Real gross domestic product (GDP) increased at an annual rate of 3.2% in the fourth quarter of 2023, according to the second estimate released by the Bureau of Economic Analysis. In the advance estimate, the increase in real GDP was 3.3%. This update primarily reflects a downward revision to private inventory that was partially offset by upward revisions to state and local government spending and consumer spending. Current-dollar GDP increased 4.9% at an annual rate in the fourth quarter, the same as in the advanced estimate. The personal consumption expenditures (PCE) price index increased by 1.8%, an upward revision of 0.1 percentage points. Excluding food and energy prices, the PCE price index increased 2.1, similarly a 0.1 percentage point increase. Current-dollar personal income, disposable personal income, real disposable personal income, and personal savings were all revised down. — Delaney O’Kray-Murphy
Arizona’s annual average unemployment rate ticked up to 3.9% in 2023 compared to 3.8% in 2022, placing it among the 42 states with little change. There were six states with significant decreases in unemployment for 2023: Maryland, Pennsylvania, Mississippi, Wyoming, Ohio, and Vermont. California and New Jersey had increased unemployment based on the U.S. Bureau of Labor Statistics annual release. The national unemployment rate was unchanged at 3.6%. North Dakota had the lowest jobless rate at 1.9%, while Nevada had the highest at 5.1%. The U.S. employment to population ratio for 2023 stood at 60.3%, while Arizona was 59.7%. The District of Columbia had the highest rate at 68.2%, followed by North Dakota at 67.9% and Utah at 67.7%. The lowest ratios in the nation were in Mississippi at 52.3% and West Virginia at 52.8%.
— Valorie Rice


