
EBRC Research Staff
Current data releases as of 29 March 2024
There were more visitors to Arizona state and national parks in 2023. At a little over 22.5 million, the total number of visits in 2023 was the highest since 2019. Before the pandemic, Arizona visitor counts topped 25 million for three years in a row, with 2017 having the largest-ever number of visitors to Arizona state and national parks. The last several years have been up and down, starting with a dramatic drop in 2020 due to travel reductions related to COVID-19 and many parks partially or fully closing for some time. Visits picked back up in 2021, only to decrease again in 2022. The 2023 visitor numbers represent a 14.5% increase over 2022. — Valorie Rice
The unemployment rate for veterans was the same in 2023 as it was in 2022 at 2.8%. Rates for male and female veterans did not stay the same, though. Both men and women had a rate of 2.8% in 2022, though the rate for men ticked down to 2.7%, and the jobless rate for women veterans rose to 3.2% in 2023. Nonveterans had higher unemployment rates across the board, with a total of 3.6% in 2023 (3.8% for men and 3.4% for women). In Arizona, the unemployment rate for veterans was 2.9% in 2023 compared with 3.7% for nonveterans. In most states, the veteran unemployment rate was lower than that of nonveterans. Arizona was one of 23 states with veteran jobless rates higher than the nation, with New Mexico posting the highest rate of 7.1%. Connecticut had the lowest unemployment rate for veterans in 2023, at 0.4%. — Valorie Rice
In February, over the month state unemployment rates were higher in three states, lower in three states, and stable in the remaining 44 states and the District of Columbia. Arizona’s seasonally adjusted unemployment rate decreased over the month and saw a statistically significant over-the-year unemployment rate increase, moving from 3.7% last year to 4.1% in February 2024. North Dakota had the lowest jobless rate in February at 2.0%, followed by South Dakota at 2.1%. California had the highest unemployment rate at 5.3%, followed by Nevada at 5.2%. Over the year, 28 states experienced unemployment rate increases, the largest of which was in Rhode Island (+1.1 percentage points). Three states had over-the-year rate decreases, the largest being Massachusetts (-0.7 percentage points). The remaining 19 states and the District of Columbia had jobless rates that were not significantly different from a year prior. Over the year, Arizona observed a 2.1% increase in seasonally adjusted employment, rising by 66,100 to 3,238,100. –Delaney O’Kray-Murphy
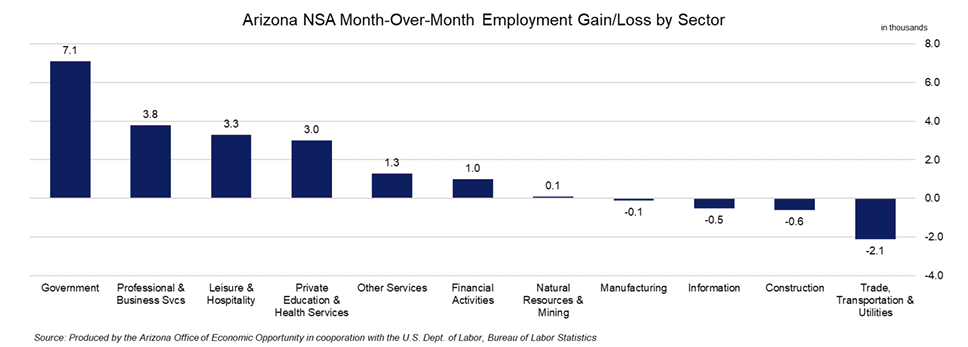
Total nonfarm employment in Arizona increased by 65,900 over the year in February, with the seasonally adjusted unemployment rate decreasing by 0.1 percentage points to 4.1%. The U.S. seasonally adjusted rate increased to 3.9% in February from 3.7% in January. Arizona monthly non-seasonally adjusted total nonfarm employment increased by 16,300, lower than the pre-pandemic average of 25,100. Employment gains were reported in government (7,100), professional & business services (3,800), leisure & hospitality (3,300), private education & health services (3,000), other services (1,300), financial activities (1,000), and natural resources & mining (100). Employment losses were reported in trade, transportation, & utilities (-2,100), construction (-600), information (-500), and manufacturing (-100). –Delaney O’Kray-Murphy
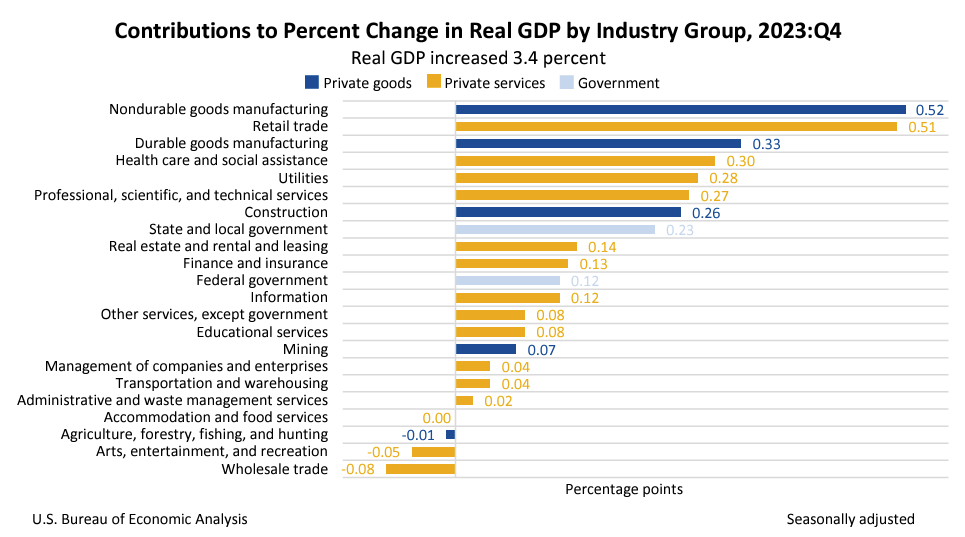
Real gross domestic product (GDP) increased at an annual rate of 3.4% in the fourth quarter of 2023, a 0.2 percentage point upward revision, according to the third estimate released by the Bureau of Economic Analysis. The update primarily reflects upward revisions to consumer spending and nonresidential fixed investment that were partially offset by a downward revision to private inventory investment. Current dollar GDP increased 5.1% at an annual rate in the fourth quarter to a level of $27.96 trillion, an upward revision of $12.4 billion from the previous estimate. The personal consumption expenditures (PCE) price index increased 1.8%, the same as in the advanced estimate. This release also includes estimates of GDP by industry. Private goods-producing industries increased 7.0%, private services-producing industries increased 2.6%, and government increased 3.1%. Overall, 18 of 22 industry groups contributed to the fourth-quarter increase in real GDP. Real GDP increased 2.5% in 2023, compared with an increase of 1.9% in 2022. –Delaney O’Kray-Murphy
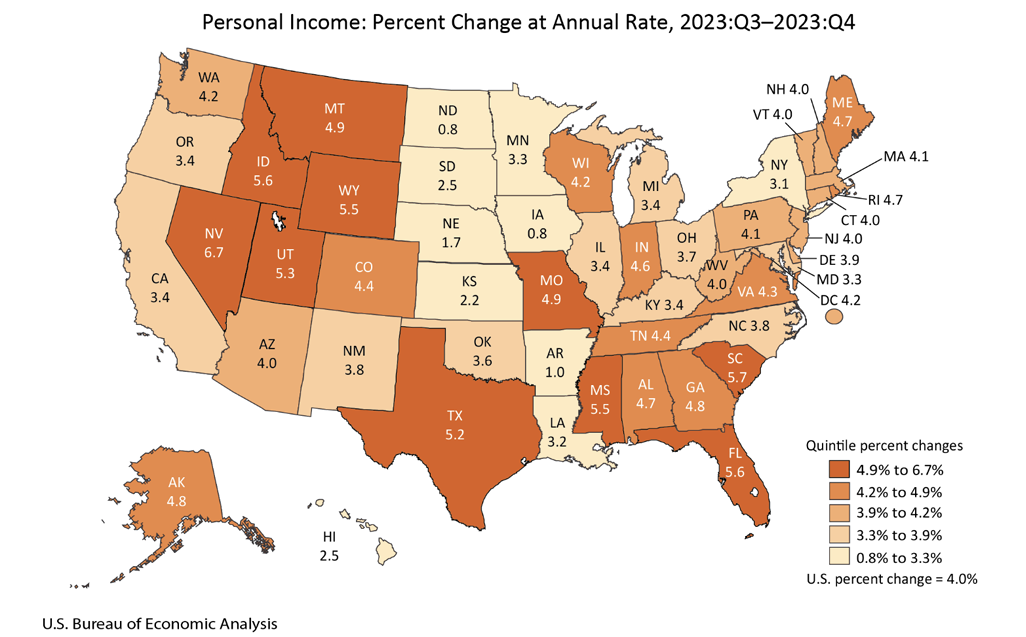
Arizona’s real GDP increased at an annual rate of 4.5% in the fourth quarter of 2023, ranking it within the top 10 states (with the ninth-highest increase). The percent change for states ranged from 0.2% in Nebraska to 6.7% in Nevada in the fourth quarter based on the March 29 U.S. Bureau of Economic Analysis release. The release also included quarterly personal income, which increased in all 50 states and the District of Columbia during the fourth quarter of 2023. Personal income changes ranged from 0.8% in Iowa and North Dakota to 6.7% in Nevada. Arizona’s personal income rose 4.0% in the fourth quarter of 2023, equal to the U.S. percent change of 4.0%. Net earnings were the largest contribution to the percent change in personal income for Arizona followed by dividends, interest, and rent while transfer receipts were negative. Transfer receipts decreased in 32 states, with Arizona reporting the biggest drop out of all states. — Valorie Rice
Phoenix house prices increased 4.6% over the year in January 2024, lower than the national increase of 6.0%. The S&P CoreLogic Case-Shiller Indices for January 2024 indicated that the 20-city composite had an over-the-year gain of 6.6%, up from the increase of 6.2% in December. San Diego had the largest gain in house prices year-over-year at 11.2%, while Portland reported the smallest at 0.9%. — Valorie Rice
In February, Arizona over-the-year total building permits saw a notable 8.2% increase to 4977, not seasonally adjusted. The number of single-family permits saw an impressive 86.8% over the year increase. The Phoenix metropolitan area accounted for most of the permits in the state, with 3957, a 6.3% increase. The number of single-family permits similarly saw significant gains, rising 106.8% to 2810. The Tucson MSA experienced similar growth patterns, with total permits rising 6.3% to 470, and single-family permits rising 65.4% to 407. Of the counties, Cochise, Gila, La Paz, Maricopa, Mohave, Navajo, Pima, Pinal, Yavapai, and Yuma saw increases, while Apache, Coconino, Graham, and Santa Cruz saw decreases. No changes were observed in Greenlee. –Delaney O’Kray-Murphy
According to the March 19th State Job Openings and Labor Turnover (JOLTS) report, job openings rates decreased in one state, increased in six states, and were little changed in all other states. The job openings rates for Arizona were 4.3% for January, 4.9% for December, and 5.5% for November. The number of job openings decreased in five states, increased in six states, and was little changed in all other states. The largest decrease in the number of job openings was in Texas (-62,000). The largest increase in the number of job openings was in New York (+82,000). Hire rates decreased in two states, increased in three states, and little changed in all other states. Oregon saw the largest increase with +1.0%, followed by Pennsylvania at +0.9%. The hire rates for Arizona were 3.8% for January, 4.1% for December, and 3.6% for November. The number of hires decreased in three states, increased in four states, and little changed in all others. Pennsylvania (+57,000) and North Carolina (+28,000) saw the largest increases in hire levels. The number of layoffs and discharges decreased in three states, increased in two states, and were little changed in all other states. The largest increase was seen in Oregon (+8,000). Nationally, the layoffs and discharges rates and total separations rates were little changed. — Alex Jaeger