

EBRC Research Staff
Current data releases as of 15 March 2024
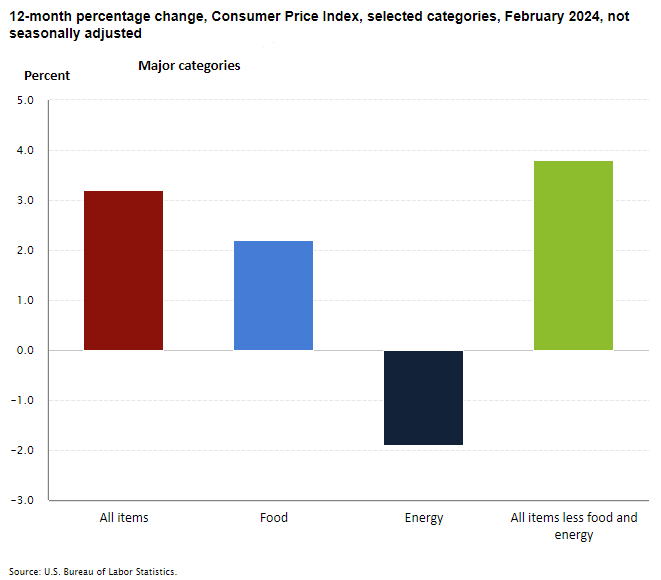
According to the U.S. Bureau of Labor Statistics, the Consumer Price Index for All Urban Consumers (CPI-U) rose 0.4% in February on a seasonally adjusted basis after increasing 0.3% in January. The index for shelter grew by 0.4 percent in February and was the largest factor in the monthly increase in the index for all items less food and energy, continuing its upward trend. Indexes for shelter and gasoline were the largest contributors to the monthly all-items increase, contributing over sixty percent of the monthly increase in the index for all items. The energy index rose 2.3% over the month as both energy commodities and energy services increased. The food index was unchanged in February, with prices for food at home staying the same and food away from home experiencing a slight increase. The index for all items less food and energy also rose 0.4% in February. Increases were observed in various sectors including airline fares, motor vehicle insurance, apparel, and recreation, while there were decreases in the prices of new vehicles and medical services. Over the last 12 months, the all-items index increased 3.2% before seasonal adjustment. The all items less food and energy index rose 3.8% over the year, driven largely by a 5.7% increase in the shelter index. However, the energy index decreased 1.9% over the 12-month period. – Rajvardhan Singh
The February 2024 Consumer Price Index for All Urban Consumers (CPI-U) indicated a 12-month increase of 3.2% for the U.S. city average; however, there was great variation among Metropolitan Statistical Areas (MSA). Among the tracked MSAs, the Miami-Fort Lauderdale-West Palm Beach, FL MSA exhibited the highest inflation rate, with all items inflation surging to 4.9%. Conversely, the Phoenix-Mesa-Scottsdale, AZ region experienced the smallest 12-month increase in all items inflation, registering at 2.2% for February. Miami-Fort Lauderdale-West Palm Beach, FL, stood out with the highest inflation rates across multiple other categories in February 2024: All Items less food and energy at 5.8%, services at 6.6%, and shelter at 7.4%. Adding to this, the Chicago-Naperville-Elgin, IL-IN-WI MSA recorded the highest inflation rate for commodities at 1.3%, and the Seattle-Tacoma-Bellevue, WA area matched Miami’s services inflation rate at 6.6% for February. Conversely, Phoenix-Mesa-Scottsdale, AZ, consistently maintained the lowest inflation rates across the board, with all items less food and energy at 2.5%, commodities at -0.7%, services at 3.9%, and shelter at 2.7% for February. It is worth noting that the Dallas-Fort Worth-Arlington MSA reports CPIU data for shelter every month, while data for all other categories is available only on odd-numbered months, thus no release for February. – Prarthana Magon
In February, the U.S. Bureau of Labor Statistics reported a 0.6% increase in the Producer Price Index (PPI) for final demand in the nation. Over the 12 months leading to February, the final demand index saw a 1.6% increase, the largest rise since September 2023. The increase in final demand prices was driven primarily by a 1.2% rise in the index for final demand goods, with prices for final demand services increasing by 0.3%. Excluding foods, energy, and trade services, the index for final demand rose by 0.4% in February and by 2.8% over the 12 months ending in February. Final demand goods saw a significant increase of 1.2% in February, primarily due to a 4.4% jump in the index for final demand energy. Prices for final-demand goods, excluding foods and energy, and final-demand foods, also increased. A notable portion of the increase in final demand goods prices was attributed to a 6.8% rise in gasoline prices. However, prices for items like hay, hayseeds, and oilseeds decreased. Final demand services increased by 0.3% in February, with notable rises in traveler accommodation services and transportation and warehousing services. Conversely, margins for final demand trade services declined. – Prarthana Magon
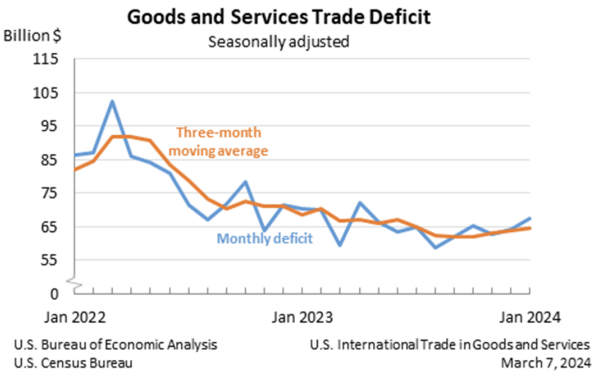
The January goods and services trade deficit came in at $67.4 billion, up $3.3 billion from a revised $64.2 billion in December. January exports rose $0.3 billion from December to $257.2 billion, and imports similarly rose $3.6 billion to $324.6 billion. The increase in the deficit reflects an increase in the goods deficit of $3.0 billion to $91.6 billion and a decrease in the services surplus of $0.3 billion to $24.2 billion. The real goods deficit increased $2.5 billion, or 3.0%, to $86.0 billion in January, compared to a 3.1% increase in the nominal deficit. The largest surpluses, in billions, occurred with South and Central America ($4.2), Netherlands ($4.2), and Hong Kong ($1.6), while the largest deficits were with China ($22.9), European Union ($18.1), and Mexico ($12.7). – Delaney O’Kray-Murphy
The January 2024 release of the Job Openings and Labor Turnover (JOLTS) report stated that the number of job openings in the U.S. changed very little to 8.9 million, while the job openings rate was unchanged at 5.3%. The industry that saw the largest increase in job openings was nondurable goods manufacturing (+82,000). The industry that saw the largest decrease was private educational services (-41,000). Nationally, the number of hires had little change at 5.7 million, with a rate of 3.6% for January, 3.7% for December, and 3.5% for November. Total separations in the nation changed little to 5.3 million, with a rate of 3.4%. The number of quits changed little to 3.4 million with a rate of 2.1%. The number of layoffs and discharges changed little at 1.6 million with an unchanged rate of 1.0%. The number of total separations in the U.S. was 5.3 million with a rate of 3.4%. – Alex Jaeger
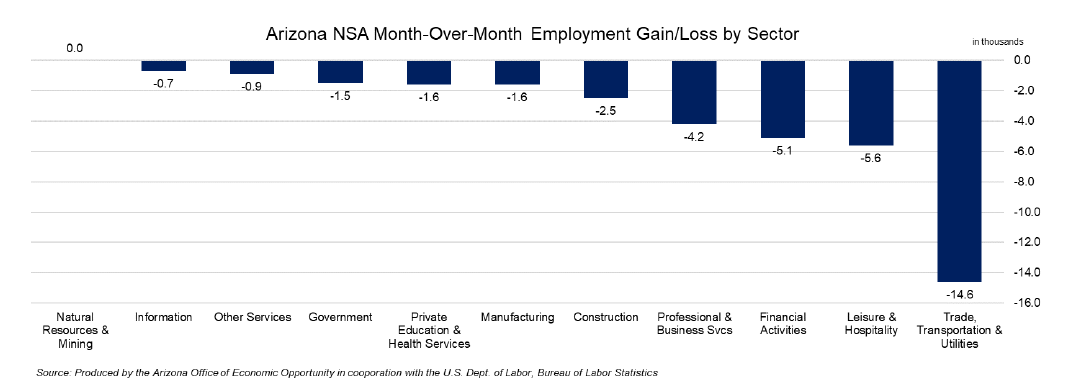
Total nonfarm employment in Arizona increased by 81,800 over the year in January, with the seasonally adjusted unemployment rate remaining at 4.2%. The U.S. seasonally adjusted rate similarly showed no change at 3.7%. Arizona’s non-seasonally adjusted total nonfarm employment decreased by 38,300 over the month, beating the pre-pandemic average of 51,000. Employment losses were reported in trade, transportation, and utilities (-14,600); leisure and hospitality (-5,600); financial activities (-5,11); professional and business services (-4,200); construction (-2,500); manufacturing (-1,600); private education and health services (-1,600); government (-1,500); other services (-900); and information (-700). No change was reported in natural resources and mining. – Delaney O’Kray-Murphy
In January, over the month state unemployment rates were higher in 4 states, lower in 2 states, and stable in the remaining 44 states and the District of Columbia. Arizona’s unemployment rate was stable over the month at 4.2% but came in 0.5 percentage points higher than last January. North Dakota had the lowest jobless rate in January at 1.9%, while Nevada had the highest at 5.3%. Over the year, 25 states saw unemployment rate increases, the largest of which were in Maine and New Jersey (+0.9 percentage points each). Six states saw over-the-year rate decreases, the largest in Massachusetts and Wyoming (-0.5 percentage points each). The remaining 19 and the District of Columbia had jobless rates that were not significantly different from a year prior. Over the year, Arizona observed a 2.4% increase in employment, rising by 77,400 to 3,239,600. – Delaney O’Kray-Murphy
In January, over the year metropolitan unemployment rates were higher in 218 of 389 metropolitan areas, lower in 148, and unchanged in the remaining 23. The January unemployment rate for the Tucson and Phoenix metropolitan areas came in at 3.7% and 3.4%, respectively. Yuma had the highest unemployment rate in Arizona at 11.0%, while Phoenix had the lowest. Burlington-South Burlington, VT, Madison, WI, and Sioux Falls, SD, shared the lowest unemployment rate at 2.0%. El Centro, CA, had the highest rate, 17.8%. The largest over-the-year increase occurred in Kahului-Wailuku-Lahaina, HI (+2.9 percentage points), and Elkhart-Goshen, IN, had the largest over-the-year rate decrease (-1.5 percentage points). – Delaney O’Kray-Murphy
The U.S. Census Bureau released county and metropolitan area 2023 population estimates on March 14. Maricopa County remained the fourth most populous county in the nation, behind Los Angeles County, CA, Cook County, IL, and Harris County, TX. It was among the top counties in the U.S. for increasing the sum of persons over the year. Pinal County led Arizona’s growth in 2023 with a 4.1% increase in population. Most of the population increase in Pinal County was due to domestic net migration, placing it among the top 10 counties in the U.S. with the highest level of domestic net migration for the year. Based on the Census Bureau estimates, half of Arizona counties had negative natural changes (more deaths than births) but positive net migration. Two Arizona counties, Apache and Cochise, experienced decreased migration and natural change, resulting in population loss over the year. Texas claimed the fastest-growing counties in the nation, with six of the top 10 counties for percent growth coming from that state. Florida had the fastest-growing metropolitan areas in the nation. Phoenix-Mesa-Chandler added the eighth-largest number of people between 2022 and 2023 out of all metropolitan areas but was not among those with the highest percentage change. – Valorie Rice


