

EBRC Research Staff
Current data releases as of 12 April 2024
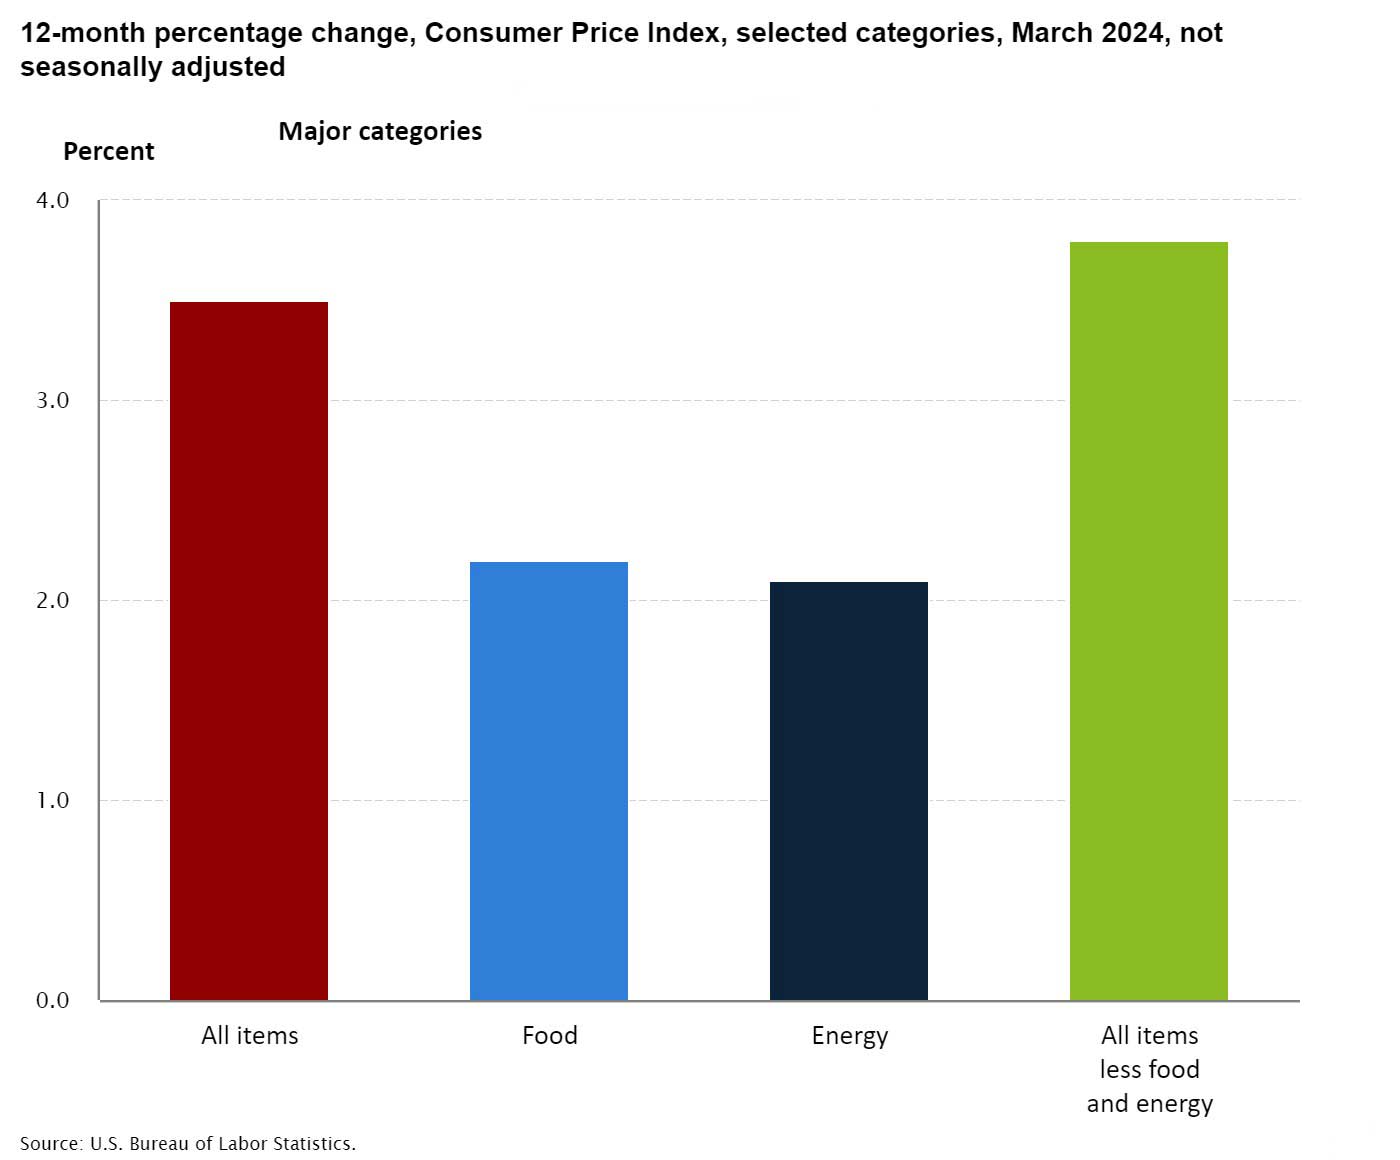
According to the U.S. Bureau of Labor Statistics, the Consumer Price Index for All Urban Consumers (CPI-U) increased by 0.4% on a seasonally adjusted basis in March, the same increase as in February. The month of March saw a rise in the shelter and gasoline prices, which combined accounted for more than half of the monthly increase in the index for all items. Over the month, the energy index increased by 1.1%, primarily due to a rise in gasoline prices. Similarly, the food index increased by 0.1%, with the index for food at home remaining stable and the index for food away from home increasing by 0.3%. The index for all items less food and energy increased by 0.4% in March, the same as in each of the two preceding months. Indexes that increased in March include shelter, motor vehicle insurance, medical care, apparel, and personal care, while indexes for used cars and trucks, recreation, and new vehicles decreased. Over the past 12 months, the index for all items rose 3.5%, a larger increase compared to the 3.2% rise for the 12 months ending February. The index for all items less food and energy increased 3.8% over the last 12 months, and the energy index increased 2.1%, marking the index’s first 12-month gain since February 2023. Lastly, the food index increased 2.2% over the past year. — Rajvardhan Singh
The largest occupational group in the U.S. in May 2023 was office and administrative support, representing 12.2% of employment. That was also the largest occupational group in Arizona, at 13.6%. The mean wage for office and administrative support occupations in the U.S. was $47,940 in 2023 compared to the U.S. average wage of $65,470 based on the April 3 Occupational Employment and Wage Statistics release from the U.S. Bureau of Labor Statistics. The average wage for office and administrative support occupations in Arizona was $47,300. Massachusetts was the state paying the most, with an average wage of $55,740, while the average in Mississippi was $38,550. The largest occupational groups were very similar for the U.S. and Arizona: office and administrative support occupations, transportation and material moving occupations, sales and related occupations, food preparation and serving related occupations, and management occupations. –Valorie Rice
The February 2024 release of the Job Openings and Labor Turnover (JOLTS) report stated that the number of job openings in the U.S. changed very little at 8.8 million, while the job openings rate was unchanged at 5.3%. The industry that saw the largest increase in job openings was finance and insurance (+126,000). The industry that saw the largest decrease was in information (-85,000). Nationally, the number of hires for February was 5.8 million, with a rate of 3.7%. The number of total separations in the U.S. was 5.6 million with a rate of 3.5%. The number of quits was 3.5 million with a rate that has not changed in four months (2.2%). The number of layoffs and discharges changed little at 1.7 million with a rate of 1.1%. –Alex Jaeger
The U.S. unemployment rate changed little in March at 3.8% while total nonfarm payroll employment rose by 303,000, according to the Bureau of Labor Statistics April 5th employment situation summary. Among the major worker groups, the unemployment rate for Blacks (6.4%) increased in March, while the rates for Asians (2.5%) and Hispanics (4.5%) decreased. The remaining groups: adult men (3.3%), adult women (3.6%), teenagers (12.6%), and Whites (3.4%) showed little or no change. Job gains occurred in health care (72,000), government (71,000), leisure and hospitality (49,000), construction (39,000), retail trade (18,000), other services (16,000), and social assistance (9,000). Employment showed little or no change in other major industries. –Delaney O’Kray-Murphy, EBRC Research Economist
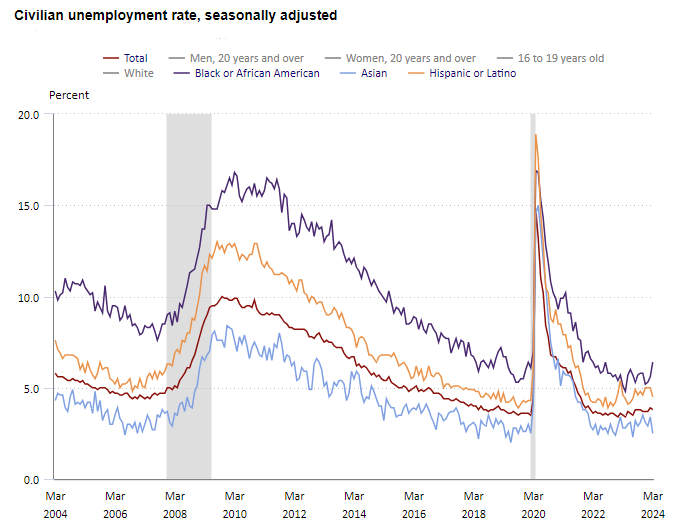
In February, over the year metropolitan unemployment rates were higher in 247 of the 389 metropolitan areas, lower in 109, and unchanged in the remaining 33. The February unemployment rate for the Tucson and Phoenix metropolitan areas came in at 3.6 and 3.3, respectively. Yuma had the highest unemployment rate in Arizona at 9.7%, while Phoenix had the lowest. Ames, IA had the lowest unemployment rate in the nation at 1.9%, and El Centro, CA, had the highest rate, 17.2%. The largest over-the-year increase occurred in Kahului-Wailuku-Lahaina, HI (+2.7 percentage points), and Barnstable Town, MA, and Ocean City, NJ, had the largest over-the-year rate decrease (-1.1 percentage points each). –Delaney O’Kray-Murphy, EBRC Research Economist
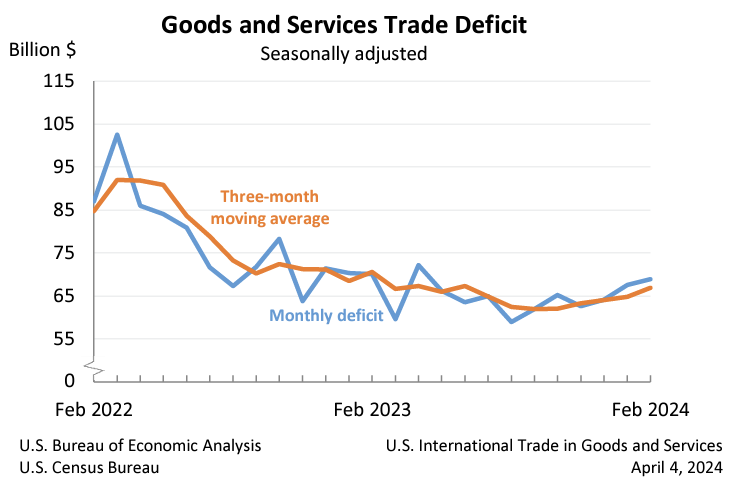
The February goods and services trade deficit came in at -$68.9 billion, up $1.3 billion from a revised $67.6 billion in January. February exports rose $5.8 billion from January to $263.0 billion, and imports similarly rose $7.1 billion to $331.9 billion. The increase in the deficit reflects a decrease in the goods deficit of $0.3 billion to $91.4 billion and a decrease in the services surplus of $1.6 billion to $22.5 billion. Over the year, the goods and services deficit decreased 2.8%, or $3.9 billion, with exports rising 1.8%, or $9.3 billion, and imports increasing 0.8%, or $5.4 billion. The largest surpluses, in billions, occurred with South and Central America ($5.5), Netherlands ($4.3), and Hong Kong ($2.8), while the greatest deficits were with China ($21.9), European Union ($17.6) and Mexico ($15.3). –Delaney O’Kray-Murphy, EBRC Research Economist
The latest report from the U.S. Bureau of Labor Statistics reveals a 0.2% increase in the Producer Price Index (PPI) for final demand in March, after seasonal adjustments. This uptick follows previous months’ trends, where final demand prices rose by 0.6% in February and 0.4% in January. Over the 12 months ending in March, the index for final demand surged by 2.1%, marking the most substantial advance since April 2023. March’s rise in the final demand index can be primarily attributed to a 0.3% increase in prices for final demand services. In contrast, the index for final demand goods saw a slight downturn of 0.1% during the same period. Breaking down the data further, the index for final demand excluding foods, energy, and trade services moved up by 0.2% in March, following a 0.3% increase in February. Over the 12 months ending in March, this category saw prices climb by 2.8%. Within final demand services, the index saw a 0.3% increase in March, marking the third consecutive rise. Notably, prices for final demand services, excluding trade, transportation, and warehousing, advanced by 0.2%. Turning to final demand goods, prices experienced a slight decline of 0.1% in March. This decline was largely driven by a 1.6% decrease in the index for final demand energy. Looking deeper into final demand goods the decline in March was led by a decrease in gasoline prices of 3.6%. Conversely, prices for processed poultry surged by 10.7%. — Prarthana Magon


