
by Valorie H. Rice
Senior Specialist, Business Information
Current Data Releases as of 17 May 2019
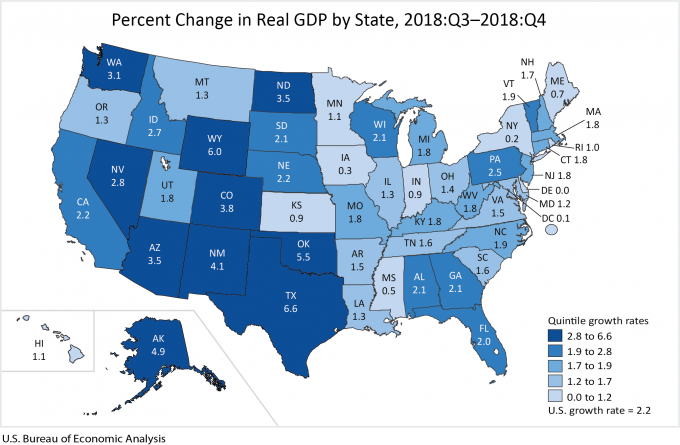
Real GDP in Arizona increased at a seasonally adjusted annual rate of 3.5% in the fourth quarter 2018. The May 1 Bureau of Economic Analysis GDP by State release included annual data as well. The increase for the year was 4.0% in Arizona, ranking the state fourth for real GDP growth from 2017 to 2018 behind Washington (5.7%), Utah (4.3%), and Idaho (4.1%).
Phoenix house prices rose 6.7% over-the-year in February. According to the S&P CoreLogic Case-Shiller indices released April 30, Las Vegas had the highest year-over-year gains for the month at 9.7% followed by Phoenix. In comparison, U.S. home prices gained 4.0% and the 20-city composite increased 3.0%. San Diego had the lowest over-the-year increase of just 1.1% for February.
U.S. nonfarm employment increased by 263,000 in April on a seasonally adjusted basis, according to the May 3 Bureau of Labor Statistics release. Professional and business services was the industry with the largest gains for the month followed by health care and social assistance. The U.S. seasonally adjusted unemployment rate moved down to 3.6% for April, the lowest is has been since December 1969.
Bankruptcy filings in Arizona numbered 1,635 during April, an increase of 10.4% over the same month last year. Year-to-date, total bankruptcies grew 10.1% compared to the same period a year ago. The Phoenix office increased 12.3% year-to-date while the Tucson office increased 6.0%. Filings in the Yuma office were down 0.4% year-to-date. The Phoenix office includes Apache, Coconino, Gila, Maricopa, Navajo, and Yavapai counties. The Tucson office handles Cochise, Graham, Greenlee, Pima, Pinal, and Santa Cruz counties, while the Yuma office represents La Paz, Mohave, and Yuma counties.
The U.S. trade deficit rose $0.7 billion to $50.0 billion in March according to the May 9 joint release from the U.S. Bureau of Economic Analysis and U.S. Census Bureau. Both exports and import rose over-the-month. Exports increased $2.1 billion to $212.0 billion while imports increased $2.8 billion to reach $262.0 billion for the month. Year-to-date, the goods and services deficit was 3.7% smaller than the same period in 2018.
Housing affordability increased for all Arizona metropolitan areas the first quarter of 2019 compared to the last quarter of 2018 according to the National Association of Home Builders Wells Fargo Housing Opportunity Index released on May 9. Nationally, 61.4% of homes sold in the first quarter (both new and used) were affordable to families earning the median income of $75,500 in the U.S., an increase from 56.6% in the fourth quarter 2018 and relatively close to the 61.6% posted for the first quarter 2018. The share of homes affordable for a median family income in Arizona metropolitan areas during first quarter 2019: Sierra Vista-Douglas, 82.4%; Yuma, 81.4%; Tucson, 69.5%; Lake Havasu City-Kingman, 67.9%; Phoenix, 63.9%; Flagstaff, 57.8%; and Prescott, 56.4%.
Arizona employment rose by 78,900 in April over-the-year according to the Arizona Office of Economic Opportunity May 16 release. That translated into 2.8% growth, a full percentage point higher than the U.S. at 1.8%. Sectors reporting the most over-the-year job growth for the month were construction followed by education and health services. Financial activities lost jobs. Over-the-year job growth in Arizona metro areas for April: Lake Havasu City-Kingman 3.3%, Phoenix 3.2%, Yuma 2.5%, Tucson 1.8%, Prescott 0.6%, Flagstaff 0.1% and Sierra Vista-Douglas 0.3%. The seasonally adjusted unemployment rate for Arizona ticked down to 4.9% for April.
Real personal income for states increased 2.6% in 2017 compared to 1.5% in 2016 as reported in the May 16 Bureau of Economic Analysis release. Arizona real personal income grew 3.4%. The percent change in real personal income for Arizona metropolitan areas for 2017: Flagstaff 2.4%, Lake Havasu City-Kingman 2.4%, Phoenix 3.8%, Prescott 2.7%, Sierra Vista-Douglas 2.8%, Tucson 4.1% and Yuma 4.6%. The report also includes regional price parities by state, indicating how much higher or lower prices in each state are compared the U.S. average. Arizona prices were 3.6% lower than the nation.
The U.S. Department of Agriculture released the 2017 Census of Agriculture on April 11. Conducted every five years, the Census of Agriculture provides insights on how the agricultural sector is doing. Notable highlights for Arizona include a 4.6% decrease in the number of farms from 2012. The average size of farms increased, however, as the total land in farms in the state remained mostly stable (decreasing less than one percent). Harvested cropland increased 2.9% to 915,647 acres with Pinal, Maricopa, and Yuma counties accounting for the majority of harvested cropland for the state. Look for a more detailed summary of 2017 Census of Agriculture findings including demographics of Arizona’s farmers and ranchers in the Arizona’s Economy this summer.