

By George W. Hammond, Director and Research Professor, EBRC
After rising at a rapid pace for many years, births to Arizona mothers collapsed during the past decade. As Exhibit 1 shows, Arizona births rose from 37,591 in 1970 to a high of 102,687 in 2007. After hitting that high, state births have declined during the past decade to just 80,393 in 2018, according to data from the Arizona Department of Health Services, Vital Statistics. That translated into a 21.7% decline.
Exhibit 1 also shows the long-run trend for Arizona deaths. After a pause during the Great Recession, the number of state deaths returned to something approximating the long-run trend.
Exhibit 1: Arizona Births and Deaths from 1970 to 2018
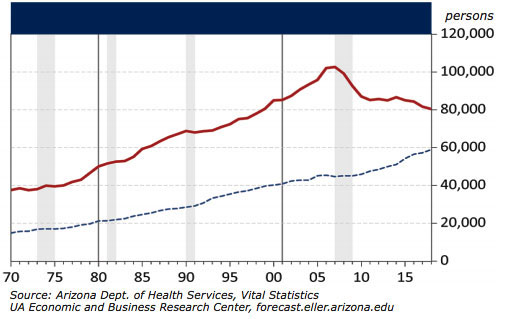
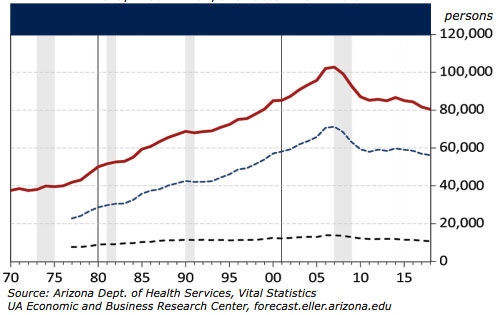
Exhibit 2 shows the trends in births for Arizona, the Phoenix Metropolitan Statistical Area (MSA), and the Tucson MSA. All three regions show similar patterns during the period, including the major decline after 2007. The percentage drop in births from 2007 to 2018 for the Phoenix MSA was 21.1%. The decline for the Tucson MSA was a bit larger at 22.8%. Thus, the experience across the state and the largest MSAs in the state was fairly similar.
Exhibit 2: Arizona, Phoenix MSA, and Tucson MSA Births
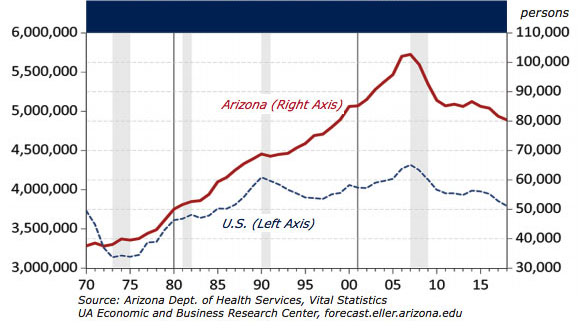
Arizona was not alone in experiencing a large drop in births. Exhibit 3 shows the trends for Arizona and the U.S. U.S. births also peaked in 2007, at 4.3 million, and declined to 3.8 million (provisionally) by 2018, a decline of 500,000. In percentage terms, U.S. births declined by 12.2%, which was much slower than the rate of decline in Arizona.
Exhibit 3: The Long-Run Trend in Arizona and U.S. Births
What caused the collapse in Arizona births? One way to explore possible causes is to disaggregate the data. Exhibit 4 shows the change in Arizona births from 2007 to 2017 by age group and ethnicity. Note that state births declined by 21,023 from 2007 to 2017. (Disaggregated data are available with a longer lag.) A drop in Hispanic births of 12,540 accounted for much of the decline (59.6%). The drop in Non-Hispanic births was significant, at 8,483, but smaller.
Exhibit 4: Arizona Births by Age Group and Ethnicity
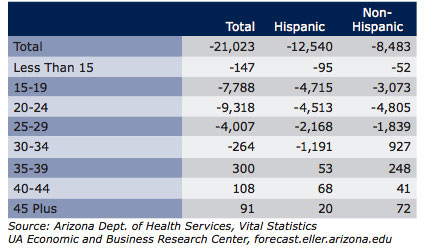
Exhibit 4 also shows that the decline in births was concentrated in the 15-29 age group for Non-Hispanics. However, for Hispanics there was also a large decline in the 30-34 age group. Births were up modestly in the 35-and-older age group for both ethnicities during the period.
To understand more clearly what happened during the past decade, we need to focus on birth rates. Overall changes in the number of births could be driven by changes in the number of females (fewer females translate into fewer births, other things constant) or changes in birth rates, or both. Since there was strong growth in the number of Hispanic females in Arizona during the last decade, changes in birth rates were likely the driving force.
Exhibit 5 shows Arizona and U.S. birth rates by the age group and ethnicity in 2017. For both Arizona and the U.S. Hispanic birth rates were much higher than Non-Hispanic birth rates. In addition, overall birth rates by ethnicity in Arizona are now below the comparable national rate.
In addition, Hispanic birth rates were highest for females in the 25-29 age group in both Arizona and the U.S. In contrast, Non-Hispanic birth rates were highest for females in the 30-34 age group, again for both Arizona and the U.S.
Exhibit 5: Arizona and U.S. Birth Rates by Age Group and Ethnicity in 2017
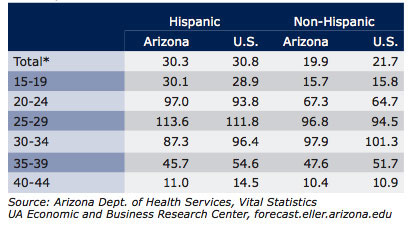
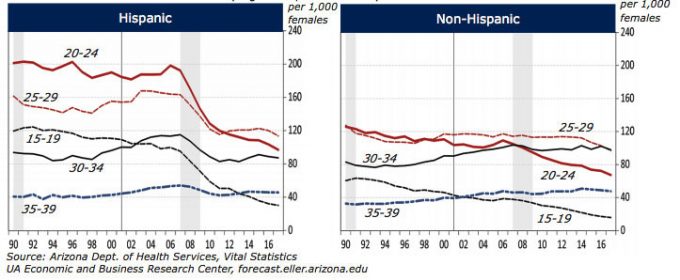
Exhibit 6 shows the trend in Arizona birth rates disaggregated by the age group and ethnicity. Note that before 2007, Hispanic birth rates were higher than Non-Hispanic birth rates for all age groups and particularly for the younger age groups.
After 2007, Hispanic birth rates, particularly for younger age groups, declined rapidly. They are now much closer, but generally still above, Non-Hispanic rates.
Exhibit 6: Arizona Birth Rate Trends by Age Group and Ethnicity
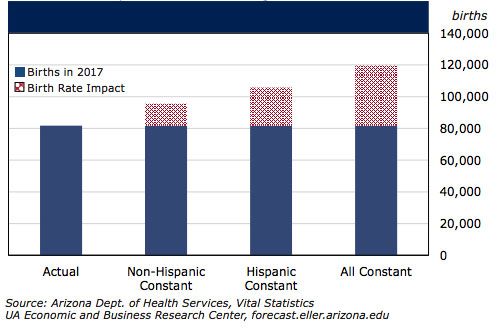
Another way to see the impact of declining birth rates is to simulate the number of births under different birth rate assumptions. Exhibit 7 shows the results for three scenarios: birth rates remain at 2007 levels for Non-Hispanics, birth rates remain at 2007 levels for Hispanics, and birth rates remain at 2007 levels for both Hispanics and Non-Hispanics. Note that these scenarios assume no impact of births on the female population of child-bearing age.
Had birth rates for Non-Hispanics remained at 2007 levels, while Hispanic births rates followed the observed trend, there would have been 95,564 births in Arizona in 2017. That is 13,900 additional births. If birth rates for Hispanics had remained at 2007 levels, while birth rates for Non-Hispanics followed the observed pattern, the simulation suggests that there would have been 105,684 births in Arizona in 2017. That is an additional 24,020 births. Finally, if birth rates for both Hispanics and Non-Hispanics remained at 2007 levels, there would have been 119,585 births in 2017, or an additional 37,921 births.
Exhibit 7: The Impact of Birth Rate Changes on Arizona Births
The precipitous drop in Arizona births since 2007 was driven by declines in both Hispanic and Non-Hispanic births. The decline in births and birth rates since 2007 was much more pronounced for Hispanic females than for Non-Hispanic females. Birth rates for younger women declined significantly since 2007 for both Hispanics and Non-Hispanics.
The big questions now are what underlying factors caused the decline in birth rates and will they ever return to pre-2007 levels? Are these caused by generational differences within immigrant communities, as more and more Hispanics are born in the U.S.? Are there complementary trends driven by economic factors affecting both Hispanic and Non-Hispanic women? Are there even deeper social trends at work? These questions remain open. Stay tuned for more discussion on these topics!


