
by Valorie H. Rice
Senior Specialist, Business Information
Current Data Releases as of 15 November 2019
Personal income increased in all Arizona counties in 2018, ranging from 3.0 percent growth in Yuma to 9.0 percent growth in Greenlee. The U.S. Bureau of Economic Analysis released local area personal income data for 2018 and revisions from 1969 to 2017 on November 14. Per capita personal income in Arizona for 2018 was highest in Coconino County at $48,129 and lowest in Pinal County at $30,644.
Compare per capita incomes in Arizona’s counties
| 2018 Per capita Personal Income ($) | |
| Arizona | $44,329 |
| Apache | $34,355 |
| Cochise | $40,308 |
| Coconino | $48,129 |
| Gila | $40,267 |
| Graham | $31,597 |
| Greenlee | $39,855 |
| La Paz | $30,948 |
| Maricopa | $47,694 |
| Mohave | $33,148 |
| Navajo | $32,165 |
| Pima | $44,028 |
| Pinal | $30,644 |
| Santa Cruz | $39,057 |
| Yavapai | $40,312 |
| Yuma | $35,682 |
| Source: U.S. Bureau of Economic Analysis | |
Arizona employment rose 2.5 percent year-to-year in October, compared to 1.4 percent for the nation. Of the 72,200 jobs gained over-the-year in October, most were in the private sector, with government gaining just 100 jobs. Industries with the highest increases in employment were education and health services; construction; and trade, transportation, and utilities. The seasonally adjusted unemployment rate ticked down to 4.8 percent for the month according to the November 14 Arizona Office of Economic Opportunity release.
Compare employment growth rates in the Western states
Compare growth rates in other western states by clicking names on/off in the legend at the bottom of the chart.
Producer prices rose 0.4 percent in October, seasonally adjusted. Final demand goods increased 0.7 percent and final demand services increased 0.3 percent for the month. The unadjusted 12-month change in prices was 1.1 percent, which was the smallest one-year increase since October 2016 according to the Bureau of Labor Statistics November 14 release.
Consumer prices increased 0.4 percent over-the-month in October. The Bureau of Labor Statistics November 13 release indicated energy price increases were a primary driver for the rise in the overall index, with the energy index increasing 2.7 percent in October. The index for all items less food and energy was up 0.2 percent. Annual inflation was 1.8 percent for October.
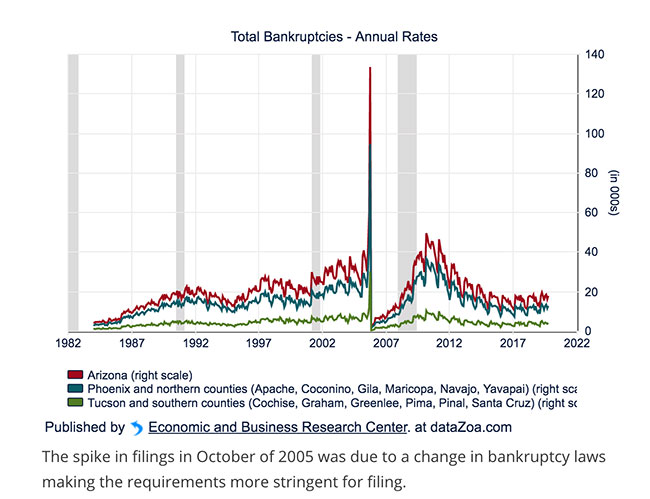
There were 1,497 Arizona bankruptcy filings in October, 2.4 percent more than the same month a year ago. Bankruptcies are up 4.2 percent year-to-date for Arizona with filings increasing 5.5 percent for the Phoenix office, 1.1 percent for the Tucson office, and 2.7 percent for the Yuma office. The Phoenix office includes Apache, Coconino, Gila, Maricopa, Navajo, and Yavapai counties. The Tucson office handles Cochise, Graham, Greenlee, Pima, Pinal, and Santa Cruz counties, while the Yuma office represents La Paz, Mohave, and Yuma counties.
Bankruptcy filings edge up in Arizona
Housing affordability improved in all Arizona metropolitan areas during the third quarter 2019 compared to the second quarter 2019. U.S. housing affordability is at the highest level in three years according to the November 7 National Association of Home Builders/Wells Fargo Housing Opportunity Index release. Nationally, 63.6 percent of new and existing homes bought in the third quarter were affordable for families earning a median income of $75,500. In comparison, the share of affordable homes in the second quarter 2019 was 60.9 percent. Only Flagstaff and Prescott had a lower share of homes affordable for their area median family income compared to the U.S. with 56.6 percent and 57.7 percent, respectively. The shares for other Arizona metropolitan areas wer Sierra Vista-Douglas 85.0 percent, Yuma 79.4 percent, Tucson 72.9 percent, Lake Havasu City-Kingman 70.9 percent and Phoenix-Mesa-Scottsdale 68.0 percent.
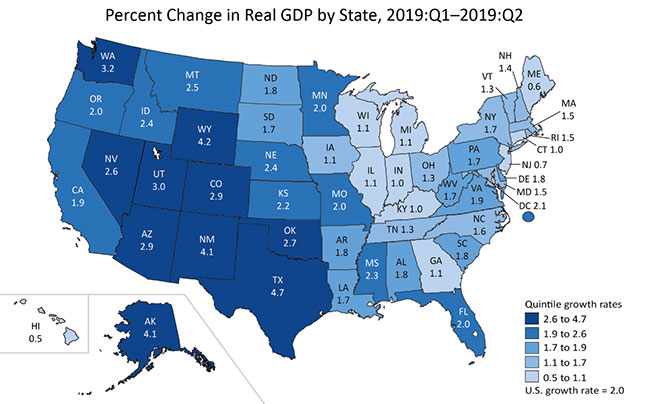
Real GDP in Arizona increased at a seasonally adjusted annual rate of 2.9 percent in the second quarter 2019. Increases in real GDP by state ranged from 4.7 percent in Texas to 0.5 percent in Hawaii for the second quarter. Arizona was among the top ten states for GDP growth, ranking eighth, according to the November 7 Bureau of Economic Analysis release. Arizona’s GDP revised upward for 2017 and 2018 based on revisions included in the current release.
Compare real GDP growth across the U.S.
The U.S. trade deficit was lower in September at $52.5 billion compared to the revised August figure of $55.0 billion. Both exports and imports were down for the month with exports at $206.0 billion and imports at $258.4 billion. Year-to-date, the deficit in goods and services was 5.4 percent above the same period in 2018 according to the November 5 joint Census Bureau and Bureau of Economic Analysis release.
The U.S. gained 128,000 nonfarm payroll jobs in October according to the November 1 Bureau of Labor Statistics report. Both August and September employment figures revised upward, putting the average job gains over the last three months at 176,000. Food services and drinking places, social assistance, and financial activities were the industries with the largest growth over-the-month. The national unemployment rate for October was 3.6 percent.