by Valorie H. Rice
Senior Specialist, Business Information
Current data releases as of 22 May 2020
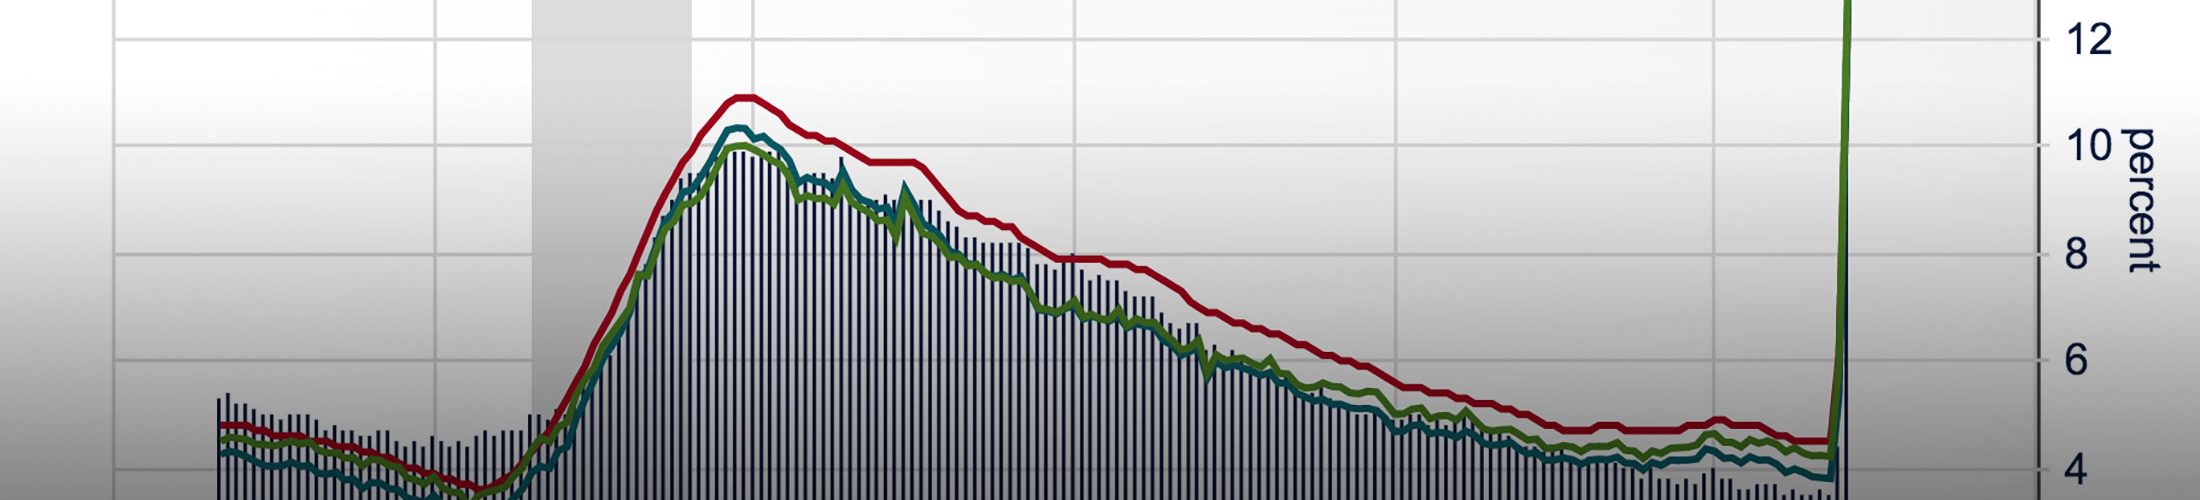
Nonfarm employment in Arizona dropped 7.9 percent over-the-year in April, not as large as the drop of 12.9 percent for the U.S. Leisure and hospitality had deep job losses month-over-month as well as year-over-year followed by trade, transportation and utilities (particularly retail trade) according to the Arizona Office of Economic Opportunity May 21 release. Natural resources and mining was the only sector to have positive job numbers for both periods. Along with employment losses, the seasonally adjusted unemployment rate for Arizona soared to 12.6 percent in April compared to 6.1 percent in March. The unemployment rate for Arizona had been 4.8 percent in April 2019.
Click sectors on/off in legend below the chart. Your cursor becomes a tooltip.
Arizona was not alone in having a large increase in unemployment rate for April as all 50 states plus the District of Columbia reported higher unemployment rates according to the State Employment and Unemployment report from the U.S. Bureau of Labor Statistics released May 22. At 12.6 percent, April’s unemployment rate for Arizona was the highest since this series began in 1976. In fact, 43 states set new series highs. Nevada had the highest unemployment rate for April at 28.2 percent and experienced the largest rate increase as well, moving up 21.3 percentage points compared to March. Connecticut had the lowest unemployment rate at 7.9 percent.
Click titles on/off in the legend at bottom of the chart to compare other states.
Buckeye and Goodyear were among the fastest-growing large cities in the U.S. since 2010, with increases of 56.6 percent and 33.1 percent respectively over the last nine years. Frisco, TX grew the fastest between 2010 and 2019, increasing 71.1 percent. The majority of fastest-growing cities and towns were in the West or South. Phoenix city topped the list cities with the largest numeric change over the last nine years and remained the fifth largest city in the nation for 2019, just above Philadelphia.

Maricopa County was among the counties with the largest gains in employment from December 2018 to December 2019 according to the fourth quarter 2019 County Employment and Wages report from the U.S. Bureau of Labor Statistics released May 20. Cleveland, OK had the largest over-the-year gain in employment at 5.8 percent while Maricopa County had the ninth highest increase at 3.5 percent. Of the 10 largest counties in the nation, Maricopa posted the largest gain. Pima County, the only other county in Arizona listed in the news release, had an increase of 0.4 percent. Average weekly wages for the nation were up 3.5 percent over-the-year in the fourth quarter 2019 with Santa Cruz, CA posting the highest increase at 20.7 percent and Linn, IA at the other end of the spectrum with a 7.1 percent decrease. The change in wages for Pima and Maricopa counties between fourth quarter 2018 and fourth quarter 2019 were higher than the nation at 4.9 percent and 4.0 percent, respectively.
Arizona had virtually the same percentage of women-owned and veteran-owned businesses as the nation in 2017 but had a higher percent of Hispanic-owned businesses. According to the 2018 Annual Business Survey from the U.S. Census Bureau (covering year 2017), 6.1 percent of all businesses in the U.S. were owned by veterans while 6.0 percent in Arizona were veteran-owned. Arizona businesses headed by women made up 19.6 percent of the total compared to 19.7 percent for the nation. Arizona had a higher percentage of Hispanic-owned businesses, at 7.2 percent than the nation at 5.6 percent. The top two sectors for Hispanic-owned firms were construction followed by accommodation and food services. This held true for both the U.S. and Arizona.
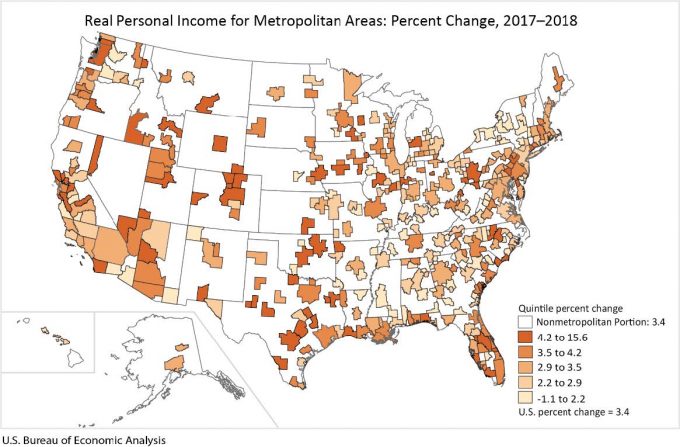
Real state personal income increased 3.4 percent in 2018. Arizona real personal income grew slightly more than the nation at 3.5 percent. Real state personal income changes in 2018 ranged from 6.7 percent in Wyoming to 0.9 percent in Mississippi according to the May 18 U.S. Bureau of Economic Analysis Real Personal Income by State and Metropolitan Area, 2018 release. The percent change for Arizona metropolitan areas for 2018: Flagstaff 2.3 percent, Lake Havasu City-Kingman 3.7 percent, Phoenix 3.9 percent, Prescott Valley-Prescott 5.4 percent, Sierra Vista-Douglas 2.0 percent, Tucson 3.6 percent, and Yuma 1.6 percent. The report also includes regional price parities by state. This indicates how much higher or lower prices are in each state compared to the U.S. average. Arizona prices were 3.5 percent lower than the nation.
Spending per pupil for elementary and secondary education during the 2018 fiscal year was $12,612 in the United States, an increase 3.4 percent according to the May 11 U.S. Census Bureau release. Spending increased 2.9 percent in Arizona during that period, placing per pupil current spending at $8,239 for the state. This tied with Oklahoma near the bottom of all states with only Idaho and Utah having lower amounts. Arizona had the lowest per pupil spending of any state for instruction (which includes salaries, benefits, supplies, materials, and contractual services). Arizona was among the top five states with the highest percent of revenue for public school systems coming from the federal government at 13.2 percent. Alaska had the highest percentage from the federal government at 15.8 percent and Massachusetts had the lowest at 3.9 percent.

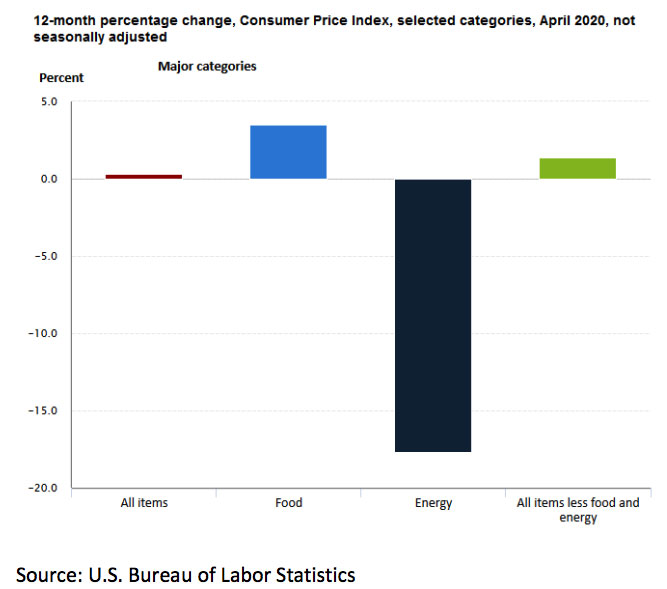
The U.S. Consumer Price Index (CPI-U) was down 0.8 percent in April on a seasonally adjusted basis. This was the largest monthly decline since December 2008 according to the U.S. Bureau of Labor Statistics May 12 release. There were several areas with stark changes, the main one being gasoline, which dropped 20.6 percent for the month leaving the energy index down 10.1 percent. Food prices, however, went the other direction with the largest one-month increase since February 1974. The index for all items less food and energy declined 0.4 percent, which was the largest monthly decline in the history of the series (going back to 1957). The annual inflation rate was 0.3 percent for April.
There were 1,047 bankruptcy filings in Arizona for April. This was 418 less than March and a 36.0 percent decrease from April 2019. Cochise and Pima counties had the highest percent decrease in filings compared to the same month a year ago. Chapter 7 (liquidation) and Chapter 13 (individual debt adjustment) were the two forms of bankruptcy with the biggest over-the-year drop in April at 33.6 percent and 48.0 percent, respectively. There were no Chapter 12 (family farm) filings in April. Year-to-date, bankruptcies are down 13.3 percent statewide, 10.2 percent for the Phoenix office, 24.3 percent for the Tucson office and 2.7 percent for the Yuma office.
Sierra Vista-Douglas was among the top metropolitan areas in the nation with the highest share of homes affordable for a family earning the area’s median income during the first quarter 2020 according to data from the National Association of Home Builders (NAHB)/Wells Fargo Housing Opportunity Index (HOI), released May 7. Nationally, 61.3 percent of new and existing homes sold in the first quarter were affordable for a family earning an adjusted U.S. median income of $72,900. The median income data comes from the U.S. Department of Housing and Urban Development (HUD). Since those estimates were formed prior to the COVID-19 pandemic, NAHB revised income estimates downward based on internal forecasts to account for the effects of the pandemic. The new calculations are 7.1 percent lower than the initial estimates for the U.S. Income and affordability were lower than the previous quarter for all Arizona metro areas except for Sierra Vista. The share of homes affordable for the median family income of the metro area for Arizona in the first quarter 2020, by affordability: Sierra Vista-Douglas 90.9, Tucson 71.0, Lake Havasu City-Kingman 67.5, Phoenix 63.0, Flagstaff 50.9, and Prescott 46.9. Yuma was not included in the first quarter data.