

by Valorie H. Rice
Senior Specialist, Business Information
Current data releases as of 31 July 2020
Real GDP data releases for the states lag the national release, and we will not see second quarter GDP numbers for the states until October. However, the impacts of the pandemic can be seen in the first quarter numbers released on July 7. All 50 states had lower real GDP in the first quarter 2020. Arizona fared better than most, with a decrease of 3.6 percent seasonally adjusted annual rate placing it among the ten states with the smallest declines according to the July 7 Bureau of Economic Analysis release. Nebraska posted a -1.3 percent change in real GDP for the first quarter while the largest change was in New York and Nevada at -8.2 percent. Real GDP in the U.S. declined 5.0 percent in the first quarter, Exhibit 1. Accommodation and food services contributed to the decreases for all 50 states. Exhibit 1: Compare Real GDP Growth by State
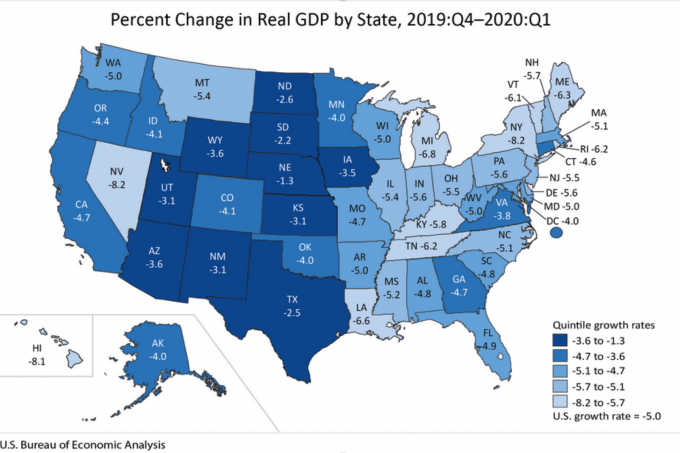
Exhibit 2 charts year-over-year percent change in quarterly GDP for Arizona, the U.S. and Western states; the chart defaults to Arizona and the U.S., but you can use your cursor as a tooltip to click state names ON/OFF to make comparisons with other states. And please note the U.S. displays one extra quarter because the state GDP numbers lag the national.
Exhibit 2: Compare Real GDP Growth for Arizona, U.S. and Western States
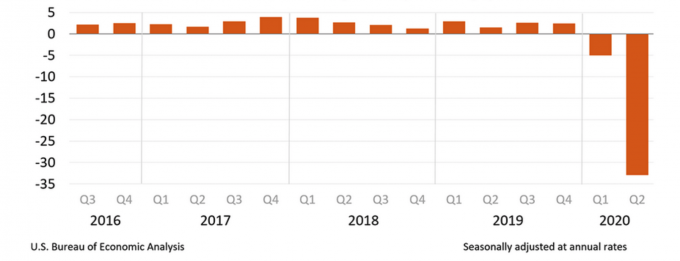
The advance estimate for U.S. real GDP in the second quarter 2020 fell at a staggering 32.9 percent annual rate. The decline began in to show up in the first quarter GDP with a decrease of 5.0 percent (annual rate). According to the July 30 Bureau of Economic Analysis release, the decline reflected the response to the COVID-19 pandemic, though the full effects are not yet be fully captured by the advance GDP estimate. A revised estimate for second quarter GDP will be released on August 27 based on more complete source data (see Exhibit 3).
Exhibit 3: Real GDP U.S. – Percent Change From Preceding Quarter
Arizona’s seasonally adjusted unemployment rate was 10.0 in June, very different from the 4.8 percent unemployment rate in June of last year according to the July 17 Bureau of Labor Statistics State Employment and Unemployment release. While Arizona’s unemployment rate was 5.2 percentage points higher than the same month a year ago, other states had even larger over-the-year increases, such as Massachusetts with 14.5 percentage points. Some states, such as New York, had record low unemployment rates at the beginning of the year now have record high rates. Nonfarm employment grew in all 50 states over-the-month for June 2020, but decreased over-the-year. In Exhibit 4, you can compare Arizona’s unemployment rate to the U.S. and other Western states.
Exhibit 4: Compare Unemployment Rates for Arizona, U.S. and Western States
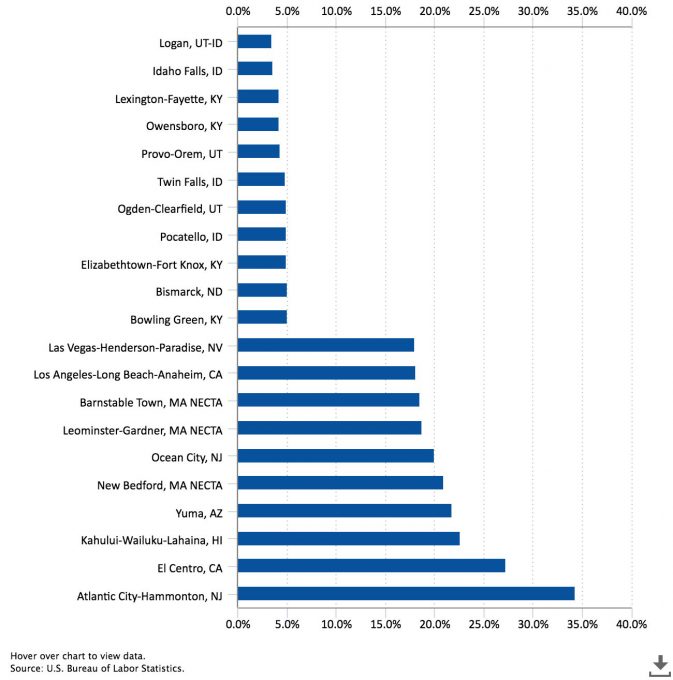
June 2020 unemployment rates in metropolitan areas ranged from an unadjusted low of 3.5 percent in Logan, UT-ID to a high of 34.3 percent in Atlantic City-Hammonton, NJ based on the July 29 Bureau of Labor Statistics release. The unemployment rate for the U.S. was 11.2 percent in June before seasonal adjustment and most metropolitan areas had rates that were lower than the U.S. In Arizona, there were three metropolitan areas with unemployment rates higher than the nation – Yuma at 21.8 percent (which typically has among the highest rates in the nation), followed by Flagstaff at 13.3 percent and Lake Havasu City-Kingman at 12.8 percent. The metro areas below the U.S. rate were Tucson at 9.9 percent, Phoenix at 9.7 percent, Prescott at 9.2 percent, and Sierra Vista-Douglas at 8.8 percent. Metropolitan area unemployment rates are reported as not seasonally adjusted.
Exhibit 5: Metropolitan Area Unemployment Rates by Lowest and Highest Rates (Not Seasonally Adjusted), June 2020
Arizona employment for June was 3.3 percent lower than the same month last year, before seasonal adjustment. The July 16 Arizona Office of Economic Opportunity release indicated that trade, transportation and utilities gained jobs over-the-year in June. So did other services, financial activities, and education and health services. Once again, the leisure and hospitality sector posted substantial losses over-the-year followed by professional and business services and government. At 1.5 percent growth, Sierra Vista-Douglas was the only Arizona metropolitan area to have positive year-over-year employment change in June. All other metropolitan areas in the state lost jobs: Prescott -0.9 percent, Tucson -2.8 percent, Phoenix -3.0 percent, Yuma -5.1 percent, Lake Havasu City-Kingman -7.5 percent, and Flagstaff -15.2 percent. The June seasonally adjusted unemployment rate for Arizona was 10.0 percent, up one percent from May. The seasonally adjusted U.S. unemployment rate was 11.1 percent in June.
Phoenix continued to have the highest home price gains in the S&P CoreLogic Case-Shiller Index with an over-the-year increase of 9.0 percent for May 2020. Seattle and Tampa rounded out the top three metros with 6.8 percent and 6.0 percent increases, respectively. Chicago one-year change in house prices was 1.3 percent, which was the smallest increase of the 19 cities reported for the month. Home prices nationally gained 4.5 percent over-the-year in May; a slight decrease from the previous month based on the July 28 release. As with the previous two months, Detroit was not included in May due to records delays for the largest county in the Detroit metropolitan area. The 19-city composite had a one-year change of 3.7 percent in home prices.


