High-Frequency Data Update
September 13, 2020 – Arizona initial claims for regular unemployment insurance fell slightly for the week ended September 5 to 11,343. Regular initial claims have fallen significantly from levels reached in the spring, but remain very high. In contrast, initial claims for Pandemic Unemployment Assistance (PUA) continued to climb last week, hitting 172,651. PUA claims dropped dramatically in early August as the Arizona Department of Employment Security stepped up fraud prevention measures.
The Arizona Department of Employment Security reports that it has paid $10.8 billion in unemployment insurance benefits from early March through September 5. To put that in perspective, that is 3.2% of Arizona’s personal income last year. While the $600 weekly supplement federally funded by the CARES Act expired in late July, it has been replaced by a $300 weekly supplement authorized by the President using funds from FEMA. According to media reports, this supplement ended last week.
National initial claims for unemployment insurance rose slightly for the week ended September 5 to 857,148 on a nonseasonally-adjusted basis. We now track nonseasonally-adjusted claims because the U.S. Department of Labor recently changed the model used for seasonal adjustment, which makes the seasonally-adjusted data more difficult to interpret. National initial claims for Pandemic Unemployment Assistance also increased last week to 838,916.
The U.S. hotel occupancy rate increased slightly for the week ended September 5 to 49.4%. That was 25.9% below the same week last year.
U.S. movie box office sales climbed to $16.0 million for the week ended September 3 to reach its highest level since mid-March. Sales should rise again next week to reflect a major new movie release for the Labor Day weekend (Tenet).
TSA traveler throughput finally broke the 5.0 million passenger barrier for the week ended September 5, reaching 5.1 million. Passenger throughput has been stuck around 5.0 million for nine weeks.
According to data from OpenTable, seated diners at restaurants in Arizona and Phoenix increased during the week ended September 5. Activity for the state has surpassed mid-June levels, but remains well below normal. Phoenix activity was nearly back to mid-June levels. These data reflect online reservations, phone reservations and walk-ins at restaurants that use the OpenTable app. It represents a fairly narrow slice of the restaurant industry.
Data from the Google Maps app suggest that travel to retail and recreation places trended up again last week for Arizona, Maricopa County, and Pima County. However, travel to these destinations remained below mid-June.
New business applications in Arizona fell slightly for the week ended September 5 to 630. However, that was 43.2% above applications last year. It pulled growth in the 52-week average to 7.1% over the year.
Population Migration to Arizona
The pandemic has generated speculation that Arizona might experience a surge of new migrants from other states, particularly if remote workers begin to flee high-cost metropolitan areas in large numbers. If Arizona does experience a surge in in-migration, it is likely to come from states that already have an established pattern of sending people to the state. That makes it a good time to review the latest Census data on migration flows into Arizona.
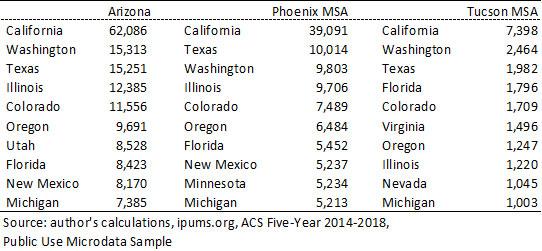
Exhibit 1 shows the top 10 states contributing migrants to Arizona, Phoenix, and Tucson. These are five-year estimates (2014-2018) from the Census American Community Survey PUMS and represent one-year gross population flows into Arizona. These are not net flows.
As the exhibit shows, California contributed by far the most migrants into Arizona, Phoenix, and Tucson during the period. Texas and Washington rounded out the top three contributing states for each region.
Exhibit 1: California Contributed by Far the Most Migrants to Arizona, ACS Five-Year Estimates (2014-2018), Annual Gross Migration Flows Into Region by State of Residence One Year Ago