

Valorie Rice, Senior Business Information Specialist
Current data releases as of 30 October 2020
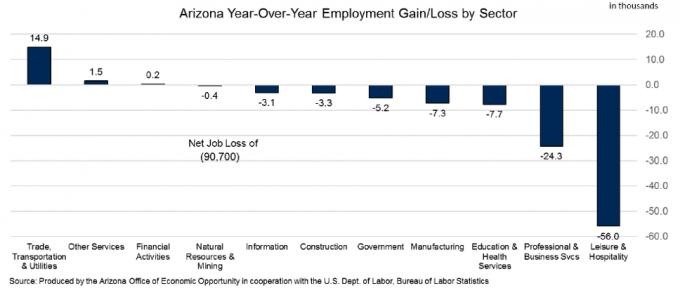
Arizona employment in September was 3.1 percent lower than the same time a year ago before seasonal adjustment compared to -6.4 percent growth in the U.S. based on the Arizona Office of Economic Opportunity October 15 release.
Over-the-year changes by sector looked much as they have the last several months with heavy losses for leisure and hospitality followed by professional and business services. Trade, transportation and utilities posted gains in employment along with other services and financial activities.
Year-over-year employment changes for Arizona metropolitan areas ranged from a loss of 15.2 percent in Flagstaff to 2.4 percent growth in Sierra Vista. The rest of Arizona metropolitan areas had negative job growth, Prescott -0.5 percent, Phoenix -2.9 percent, Lake Havasu City-Kingman -3.8 percent, Tucson -4.0 percent, and Yuma -4.3 percent. Arizona’s seasonally adjusted unemployment rate was 6.7 percent for September, up 0.8 from August.
Arizona’s seasonally adjusted unemployment rate was 6.7 percent for September, up 0.8 from August.
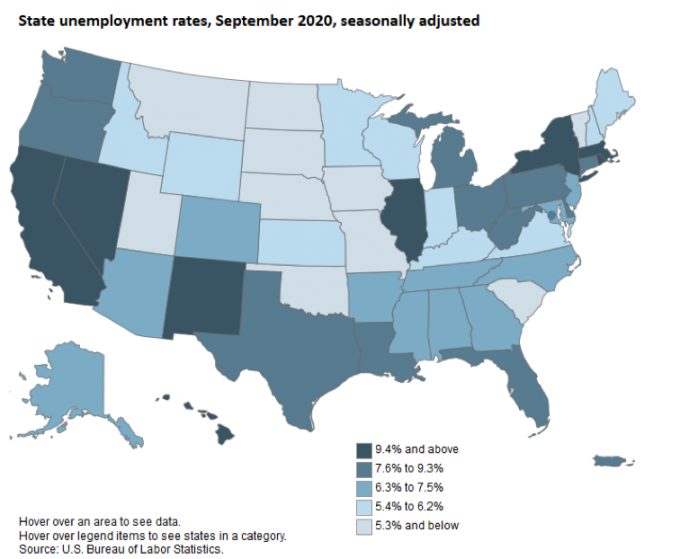
Arizona’s September state unemployment rate of 6.7 percent was 1.2 percentage points lower than the nation making it one of 27 states with a jobless rate lower than the U.S. for the month according to the October 20 Bureau of Labor Statistics release. Unemployment rates for September varied between a high of 15.1 percent in Hawaii to the lowest rate of 3.5 percent in Nebraska. There were five states with double-digit jobless rates for the month – Hawaii, Nevada, California, Rhode Island, and Illinois. All states and the District of Columbia had higher unemployment rates than they did this time last year.
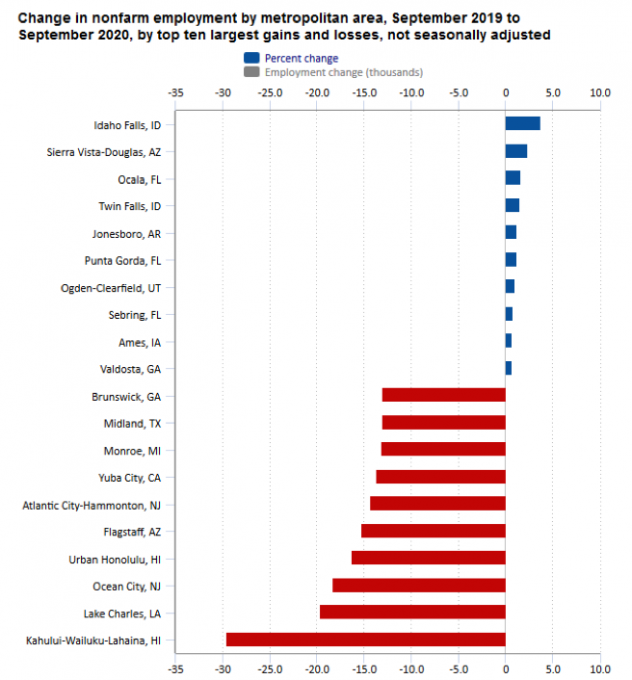
Arizona metropolitan areas could be found in both the top ten largest gains and losses of over-the-year employment changes in September based on the October 28 Metropolitan Area Employment and Unemployment report. Sierra Vista-Douglas was one of the few metropolitan areas in the country with a positive change in employment while Flagstaff was among the metropolitan areas most hurt by employment losses. Hawaii and New Jersey had two metro areas each in the bottom ten. Unemployment rates for metropolitan areas in September ranged from a high of 23.6 percent in Kahului-Wailuku-Lahaina, HI to a low of 2.8 percent found in both Ames, IA and Jefferson City, MO. Yuma was the only metropolitan area out of 389 listed in the report with a lower unemployment rate in September than the year previous at 17.0 percent compared to 19.2 percent in September 2019.
Phoenix remains in the lead; having the highest gain in home prices for the 15th consecutive month in August with 9.9 percent change over-the-year followed by Seattle at 8.5 percent and San Diego at 7.6 percent according to the October 27 S&P CoreLogic Case-Shiller Indices. Once again, Chicago had the smallest one-year change in house prices at 1.2 percent out of the 19 cities reporting for the month (Detroit data were excluded). The national home price index had 5.7 percent annual gain in house prices in August while the 20-city composite increased 5.2 percent.
The Consumer Price Index increased 0.2 percent in September on a seasonally adjusted basis. Prices for used car and truck prices accounted for the largest portion of the overall index rise. The monthly change in the used car and truck index was the highest in over 50 years at 6.7 percent according to the October 13 Bureau of Labor Statistics release. The energy index rose 0.8 percent due to increase in natural gas prices. The food index was unchanged with food away from home increasing while food at home declined. The index for all items less food and energy rose 0.2 percent for the month. The annual inflation rate for September was 1.4 percent before seasonal adjustment.
The advance estimate for U.S. real GDP in the third quarter 2020 increased at an annual rate of 33.1 percent. Keep in mind that this does not mean real GDP grew 33.1 percent in one quarter! It actually grew 7.4 percent percent during the third quarter. “Annualized rate” means that if it grew at 7.4 percent for four quarters (a year) it would be up 33.1 percent by the end of year. To further rain on the parade, real GDP dropped 9.0 percent in the second quarter (34.1 percent annualized decline), and 1.3 percent in first quarter 2020 (5.0 percent annualized decline). As you can see from the chart below, this large third quarter gain was still not enough to pull up even to where the economy was before the pandemic hit because we are climbing out of a really deep hole. Currently real GDP is 2.9 percent lower than the same quarter a year ago. The October 29 Bureau of Economic Analysis release indicated that the third quarter GDP reflected some of the increases in consumption and business activity that were postponed or curtailed earlier in the year due to COVID-19. This initial estimate for the third quarter will be updated on November 25 and again in late December based on more complete source data.


