

Valorie Rice, Senior Business Information Specialist
Current data releases as of 09 October 2020
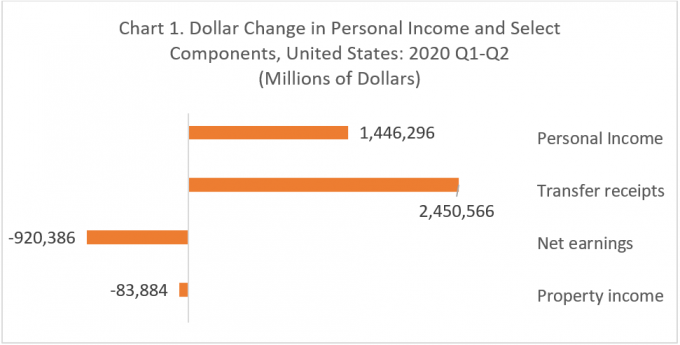
Arizona personal income rose at an annual rate of 35.1 percent for the second quarter 2020 as state personal income increased in every state and the District of Columbia during the second quarter. U.S. growth rate of 34.2 percent far exceeded the increase of 4.1 percent posted in the first quarter 2020. The September 24 Bureau of Economic Analysis released indicated that income changes driven by increases in transfer receipts more than offset losses in net earnings experienced in all states and the District of Columbia. Transfer receipts includes increased state unemployment compensation provided by the CARES Act.
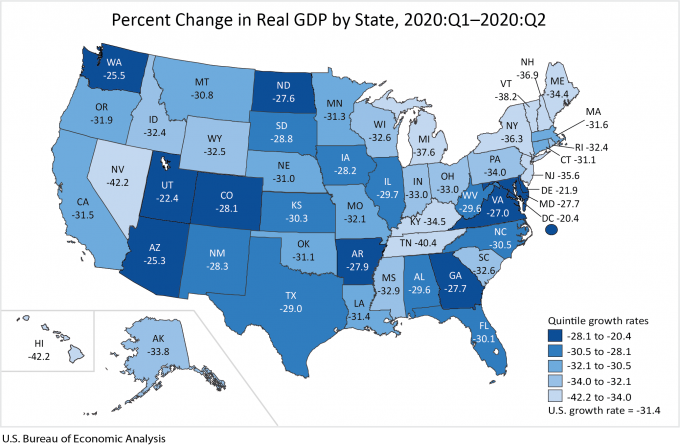
Real GDP decreased in every state and the District of Columbia in the second quarter of 2020 and the real GDP for the nation decreased 31.4 percent according to the October 2 Bureau of Economic Analysis report. Arizona was among the states that decreased the least with a seasonally adjusted annual rate of -25.3 percent. Real GDP ranged from a decline of 20.4 percent in the District of Columbia to a drop of 42.2 percent in Hawaii. Arizona’s neighboring state of Nevada also decreased 42.2 percent during the second quarter. Accommodation and food services contributed to decreases in all states as did healthcare and social assistance.
Phoenix was once again the metro area with the highest gain in home prices over-the-year for July according to the September 29 S&P CoreLogic Case-Shiller Indices. At a 9.2 percent year-over-year price increase, Phoenix topped the 19 cities reported for July followed by Seattle at 7.0 percent and Charlotte at 6.0 percent. Chicago house prices had the smallest change over-the-year at 0.8 percent. Detroit data were excluded from the July report, though are now available for March through June. The national home price index had a 4.8 percent gain in house prices in July while the 20-city composite increased 3.9 percent. These were both modestly higher than they had been the previous month.
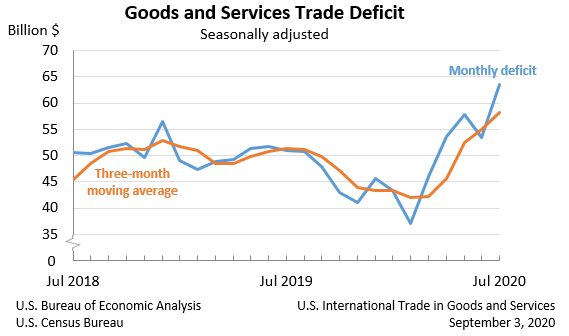
The U.S. trade deficit continued to increase in August, moving up to $67.1 billion from a revised figure of $63.4 billion for July. Both exports and imports rose but imports increased $7.4 billion over-the-month to reach $239.0 billion while exports rose $3.6 billion to stand at $171.9 billion for August. The year-to-date deficit of goods and services was 5.7 percent higher than the same period in 2019 according to the October 6 joint release from the U.S. Census Bureau and the U.S. Bureau of Economic Analysis.
U.S. nonfarm payroll employment increased by 661,000 in September. Industries recording notable gains in employment for the month were leisure and hospitality, retail trade, and health care and social assistance based on establishment survey data. The Bureau of Labor Statistics October 2 Employment Situation release indicated that revisions to July and August data combined to be 145,000 more than previously reported. The unemployment rate continued to lower in September, moving down to 7.9 percent compared to 8.4 percent in August. The employment-population ratio was 56.6 percent. Women left the labor force in much larger number than men in September. Supplemental data based on questions added to the household survey in May to help gauge the effects of the pandemic indicate that 22.7 percent of employed persons teleworked in September, down from 24.3 percent in August.
Click on any series title in the table to view a pop-up chart of trend.


