

George Hammond, EBRC Director and Eller Research Professor
Low wages (relative to the U.S.) account for most of Arizona’s income gap with the nation
According to the U.S. Bureau of Economic Analysis (BEA), Arizona’s per capita personal income (before adjustment for inflation and cost-of-living differences) was $48,950 in 2020. That was 82.0% of the national average of $59,729. In other words, Arizona’s per capita personal income was 18.0% below the nation. Keep in mind that the population estimates used for this calculation have not yet been updated to reflect the 2020 Census count.
Phoenix MSA per capita income was $48,065 in 2019 (latest available data) which was 14.9% below the U.S. Tucson MSA per capita income was $45,456, which was 19.5% below the U.S.
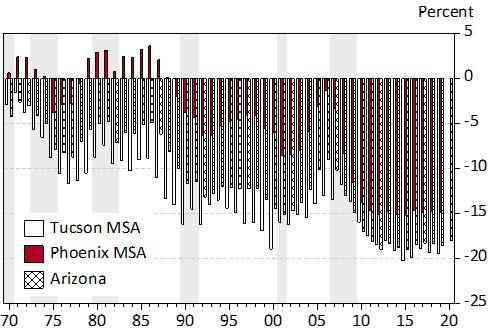
As Exhibit 1 shows, Arizona’s per capita personal income gap with the U.S. has grown significantly over time, rising from 4.2% in 1970 to 18.0% last year. Both the Phoenix and Tucson Metropolitan Statistical Areas (MSAs) show the same pattern over time.
Exhibit 1: Arizona (Phoenix and Tucson) Per Capita Income Remains Well Below the U.S., Percentage Difference from the U.S., 1970-2020
Personal income breaks down into three main components: net earnings from work; income from dividends, interest, and rent; and transfer receipts. Net earnings from work include the sum wages and salaries, proprietor’s income, and fringe benefits less social insurance payments. Transfer receipts include Social Security, Medicare, Medicaid, as well as welfare, disability, and unemployment insurance payments.
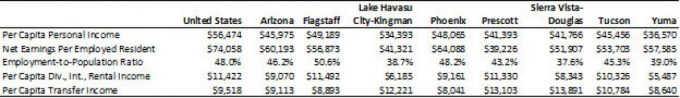
Exhibit 2 shows per capita personal income by component for the U.S., Arizona, and Arizona’s MSAs for 2019, the latest year for which complete data is available (MSA data is available with a longer lag than the state data). As the exhibit shows, per capita personal income across metropolitan areas ranged from a high of $49,189 in Flagstaff to a low of $34,393 in Lake Havasu City-Kingman.
The exhibit also includes a breakdown of per capita personal income into four components: Net earnings per employed resident (using employment from the Local Area Unemployment Statistics program); the employment-population ratio; dividends, interest, and rent per capita; and transfer income per capita. Multiplying net earnings per employed resident times the employment-population ratio would yield net earnings per capita. Net earnings per capita plus dividends, interest, and rent per capita and transfer income per capita would yield total per capita income. Using these data and concepts allows us to decompose income gaps relative to the nation for Arizona and its MSAs.
Note the variation in net earnings per employed resident, which ranged from a high of $64,088 in Phoenix to a low of $39,226 in Prescott. The employment-population ratio ranged from a high of 50.6% in Flagstaff to a low of 37.6% in Sierra Vista-Douglas. Per capita income from dividends, interest, and rent ranged from a high of $11,492 in Flagstaff to a low of $5,487 in Yuma. Per capita transfer income ranged from a high of $13,891 in Sierra Vista-Douglas to a low of $8,041 in Phoenix.
Exhibit 2: Per Capita Personal Income Decomposition for the U.S., Arizona, and Arizona Metropolitan Areas, by Income Component, 2019
Per capita personal income for the state and all MSAs in the state was below the national average in 2019. However, some of that income difference is attributable to Arizona’s relatively low cost of living.
Exhibit 3 shows per capita personal income by component adjusted for cost of living differences estimated by the BEA. Overall, Arizona’s personal income gaps are not eliminated by adjusting for the cost of living.
Exhibit 3: Cost of Living Adjusted Per Capita Personal Income Decomposition for the U.S., Arizona, and Arizona Metropolitan Areas, 2019
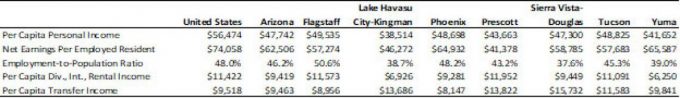
Exhibit 4 shows cost-of-living-adjusted income gaps with the U.S. Note that even after adjusting for the cost of living, income gaps ranged from $6,939 (or 12.3%) in Flagstaff to $17,960 (or 31.8%) in Lake Havasu-Kingman.
The exhibit also gives a strong indication of the major cause of Arizona’s large per capita personal income gap with the nation: net earnings per employed resident. Differences in net earnings per employed resident from the national average ranged from $8,471 (Yuma) to $32,681 (Prescott).
Exhibit 4: Gap from the U.S. for Arizona and Arizona Metropolitan, by Income Component, Cost of Living Adjusted, 2019
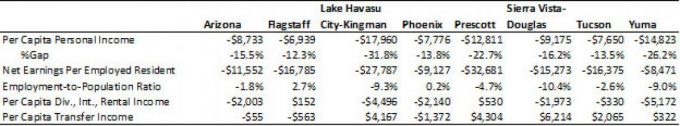
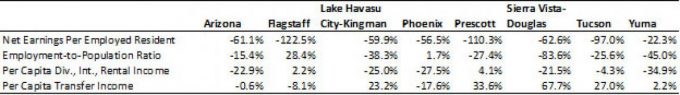
Exhibit 5 shows the percentage contributions to Arizona’s per capita personal income gap with the nation. The data in each column sum to 100%. Thus, 61.1% of Arizona’s per capita personal income gap with the nation can be attributed to below average net earnings per employed resident. Per capita income from dividends, interest, and rent accounted for an additional 22.9% of the gap, followed by a below average employment-population ratio and slightly below average income from dividends, interest, and rent per capita. Note that an income component may have a contribution of more than 100% of the gap.
For most MSAs in Arizona, the largest contribution came from low net earnings per employed resident. This was true for Flagstaff, Lake Havasu-Kingman, Phoenix, Prescott, and Tucson. For Sierra Vista-Douglas and Yuma, a low employment-population ratio was the largest contributor to the gap with the nation.
Exhibit 5: Percentage Contribution to the Per Capita Personal Income Gap with the U.S., by Income Component, Cost of Living Adjusted
Since low net earnings per employed resident was the main driver of the per capita personal income gap in Arizona, let’s dig further into the wage gaps by industry. One way to do that is to examine annual wages per worker using data from the Quarterly Census of Employment and Wages (QCEW). Keep in mind that the wage data from QCEW excludes fringe benefits.
Exhibit 6 shows annual wages per worker (before adjustment for cost of living) for 2020 by major NAICS industry for the U.S., Arizona, and all Arizona metropolitan areas. Within each area, the top three highest paying industries are highlighted. Note that wages per worker for all covered workers in Arizona were much lower than the U.S. However, there is significant variation across industries. For instance, annual wages per worker in the state were higher than the U.S. in manufacturing; education and health services; and leisure and hospitality.
In general, across Arizona metropolitan areas, wages tended to be highest in natural resources and mining; construction; manufacturing; information; financial activities; education and health services; professional and business services; and government.
Exhibit 6: Annual Wages per Worker by Major Industry for the U.S., Arizona, and Arizona Metropolitan Areas, 2020, Top Three Industries Highlighted
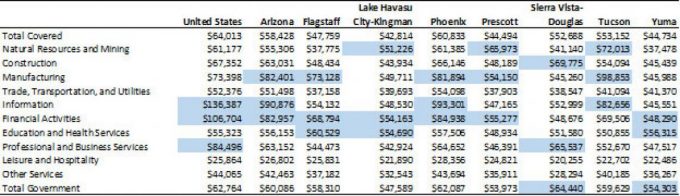
Exhibit 7 shows Arizona annual wages per worker for 2019 after adjustment for differences in the cost of living. The latest cost-of-living data is for 2019. Note again that adjustment for the cost of living does not eliminate the substantial wage gaps with the nation.
Exhibit 7: Cost of Living Annual Wages per Worker by Major Industry for the U.S., Arizona, and Arizona Metropolitan Areas, 2019
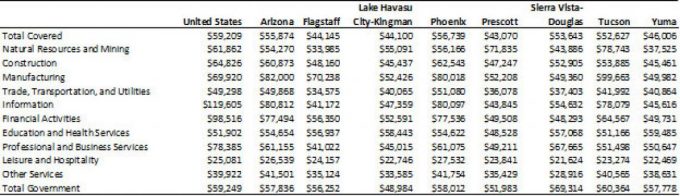
Exhibit 8 shows the cost-of-living adjusted differences with the U.S. for Arizona and its metropolitan areas. Industries for which local wages exceed the nation are highlighted. The total covered wage gap for Arizona metropolitan areas in 2019 ranged from $20,943 (Prescott) to $7,274 (Phoenix).
Annual wages for most sectors were below the national average, but the range of wage gaps was very large. Across metropolitan areas, the maximum wage gap was in the information industry. For instance, in Flagstaff annual wages in information were $95,215 below the national average. That was obviously a huge difference.
Information tends to include very high-paying technology sector jobs, as well as lower-paying communications jobs (radio, TV, print). The highest paying technology sector jobs tend to be concentrated in a few selected metropolitan areas (Silicon Valley, for instance), while the lower-paying jobs tend to be more evenly distributed across the nation. There tends to be a similar issue in financial activities and professional and business services. Essentially, the mix of jobs within the major industry matters.
Across state metropolitan areas, ten industries posted annual wages above the nation in 2019. These included natural resources and mining; manufacturing; education and health services; leisure and hospitality, and government.
Exhibit 8: Gap from the U.S., Cost of Living Annual Wages per Worker by Major Industry for Arizona, and Arizona Metropolitan Areas, 2019, Highlighted Cells Indicate that Arizona Wages Exceeded the U.S.
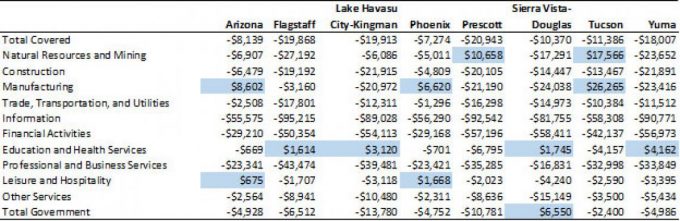
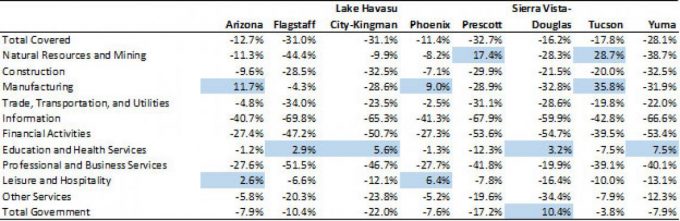
Exhibit 9 translates the wage gaps shown in Exhibit 8 into percentages. Thus, Arizona covered wages per worker were 12.7% below the nation in 2019, even after accounting for the state cost of living. In percentage terms, the wage gap ranged from -11.4% (Phoenix) to -32.7% (Prescott).
Exhibit 9: Percentage Gap from the U.S., Cost of Living Annual Wages per Worker by Major Industry for Arizona, and Arizona Metropolitan Areas, 2019, Highlighted Cells Indicate that Arizona Wages Exceeded the U.S.
Arizona’s per capita personal income gap with the U.S. has widened significantly during the past 50 years, driven primarily by a widening wage gap. Arizona’s wages remain well below the national average even after correction for cost-of-living differences.
Why are Arizona’s wages low compared to the U.S.? There are likely many reasons for this, including slow growth in education attainment (relative to the U.S.), proximity to the border, and the overall attractiveness of the state as a migration destination (which drives up labor force gains and generates downward pressure on wages).
What can be done to improve the state’s per capita income relative to the U.S.? There is no magic bullet, but there are several main drivers of long-run growth in regional standards of living. First is human capital, especially education attainment. This has been an important driver of state and local economic development during the past thirty years. It may well be even more important during the next 30 years, given emerging trends in automation.
Second is investment in infrastructure, including highways, roads, water, sewer, telecommunications, airports, and border ports of entry. Investment in infrastructure is important to ensure that the state and local areas can accommodate growth.
Third is competitive tax and regulatory policies, which make the state an attractive place for both workers and businesses to locate and prosper.


