Valorie Rice, Senior Business Information Specialist and
Shaw Zeider, Student Researcher
Current data releases as of 23 Sep 2022
The number of people primarily working from home in the U.S. tripled from 5.7% in 2019 to 17.9% in 2021 based on the recently released 2021 American Community Survey (ACS) 1-year estimates from the U.S. Census Bureau. This was the greatest percentage of people working from home recorded since the ACS began in 2005. The District of Columbia had the highest percentage of people working from home at 48.3%. States with the highest percentage of home-based workers were Washington (24.2%), Maryland (24.0%), Colorado (23.7%), and Massachusetts (23.7%). Mississippi had the smallest percentage of home-based workers at 6.3%. People working from home in Arizona went from 7.6% in 2019 to 20.7% in 2021, which placed among the top third of states with the greatest share of people working from home in 2021. The percentage of home-based workers in Phoenix was higher than the state at 23.4% in 2021 while Tucson was a bit lower at 17.9%.
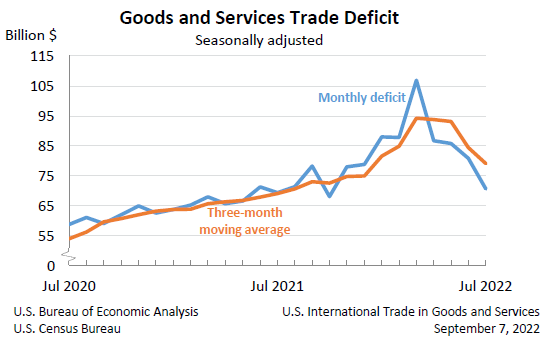
The U.S. trade deficit made a sharp drop in July, moving down $10.2 billion from a revised June figure of $80.9 billion. The $70.6 billion deficit figure reported in July was the lowest since October 2021. This was driven by a $9.7 decrease in imports but also a $0.5 billion increase in exports from June. Year-to-date, the goods and services deficit increased by $136.6 billion, or 29.0%, from the same period in 2021 based on the joint U.S. Census Bureau and Bureau of Economic Analysis September 7 release.
The Consumer Price Index rose 0.1% over the month in August. The food and medical care indexes continued to rise, both increasing 0.8% over the month. The shelter index increased 0.7% over the month. Gasoline decreased 10.6% for the month, counterbalancing increases in other areas. Over the last 12 months, the all-items index increased 8.3% before seasonal adjustment which was lower than the July increase of 8.5%.
Use your cursor as a tooltip to switch series ON/OFF at the bottom of the chart. Run your cursor over the chart to view values.
Arizona added 111,000 nonfarm payroll jobs over the year in August, a gain of 3.7%. Financial activities was the only sector with a decrease in jobs year-over-year for August. Trade, transportation and utilities lead job gains. Twelve-month job gains for Arizona metro areas were 5.9% in Flagstaff, 4.5% in Prescott, 3.9% in Phoenix, 3.3% in Yuma, 2.8% in Lake Havasu City-Kingman, 2.2% in Tucson, and 2.1% in Sierra Vista-Douglas. Arizona’s seasonally adjusted unemployment rate increased from 3.3% in July 2022 to 3.5% in August 2022. In August 2021, this figure was 4.5%.
State unemployment rates were higher in August for 16 states, including Arizona with a 0.2 percentage point from July. The other 34 states and the District of Columbia were stable for the month based on the September 16 U.S. Bureau of Labor Statistics release. The U.S. unemployment rate rose to 3.7% in August but was 1.5 percentage points lower than the same month last year. Arizona’s August unemployment rate of 3.5% was lower than the U.S., as were the jobless rates for 16 other states. Minnesota had the lowest unemployment rate at 1.9% while the District of Columbia had the highest at 5.1% followed by New York with 4.7%. Western states ranged from unemployment rates of 2.0% in Utah to 4.4% in both Nevada and New Mexico. Nonfarm payroll employment increased in 10 states, decreased in 1 state, and was essentially unchanged in 39 states and the District of Columbia for August.
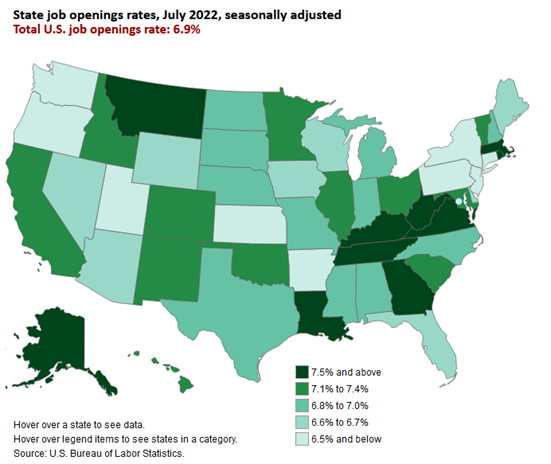
Job openings rates decreased in five states, increased in four state and were little changed in all other states including Arizona according to the September 16 State Job Openings and Labor Turnover (JOLTS) report. The job opening rate for Arizona was 6.6% after staying at 6.7% for May and June. Nationally, job openings, hires, and total separations rates had little or no change for the month. Total separations were down in Arizona for July and it had among the lowest layoffs and discharges rate out of all states.
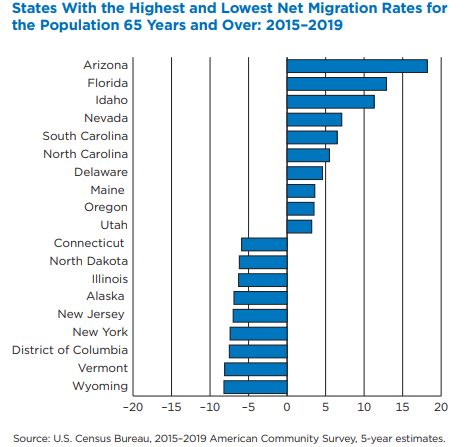
The Census Bureau released Domestic Migration of Older Americans 2015-2019 on September 22. Not surprisingly, Arizona had the highest net migration rate for the population 65 years and over, followed by Florida and Idaho. State-to-state migration flows indicated that older people typically moved either from cold weather states to warmer ones or to neighboring states. Overall, the older population was less likely to move than younger people and the moves were generally within the same county (especially for those 85 years and older).