

Valorie Rice, Senior Business Information Specialist
Current data releases as of 26 January 2023
The number of bankruptcies in Arizona dropped by 8.1% in 2022. Not as dramatic as in 2021, when there was a one-year decline of 27.5%, though it did mark the third year in a row with fewer bankruptcy filings in the state. It was also the second year in a row that filings were fewer than 1,000 a month for each month of the year. Year-to-date December figures indicate the lower number of bankruptcies was primarily due to a decrease in Chapter 7 (liquidation) filings. There were 988 fewer of them in 2022 than in 2021. This was not the case for other types of bankruptcies, however, as Chapter 11 (reorganization) and Chapter 13 (individual debt adjustment) filings both increased over the year. The Yuma office had a 25.3% decrease in bankruptcies for the year, the largest out of the three offices in the state. Bankruptcies decreased by 8.4% for the Phoenix office and 3.6% for the Tucson office. The monthly trend is visualized in Exhibit 1.
Exhibit 1. Arizona Monthly Bankruptcies by District
Phoenix house prices continue to tapper down as the 12-month change in prices reached 9.6% in October compared to 12.6% in September. The December 27 release from S&P Corelogic Case-Shiller Indices indicated that October was the fourth month in a row with declining house prices in the U.S. The national index had a 9.2% annual gain for October, down from 10.7% in September. The annual gain for the 20-city composite stood at 8.6% for October. Southeastern cities of Miami, Tampa, and Charlotte had the largest gains in house prices for the month at 21.0%, 20.5%, and 15.0%, respectively. San Francisco house prices were almost even over the year with a 0.6% 12-month change.
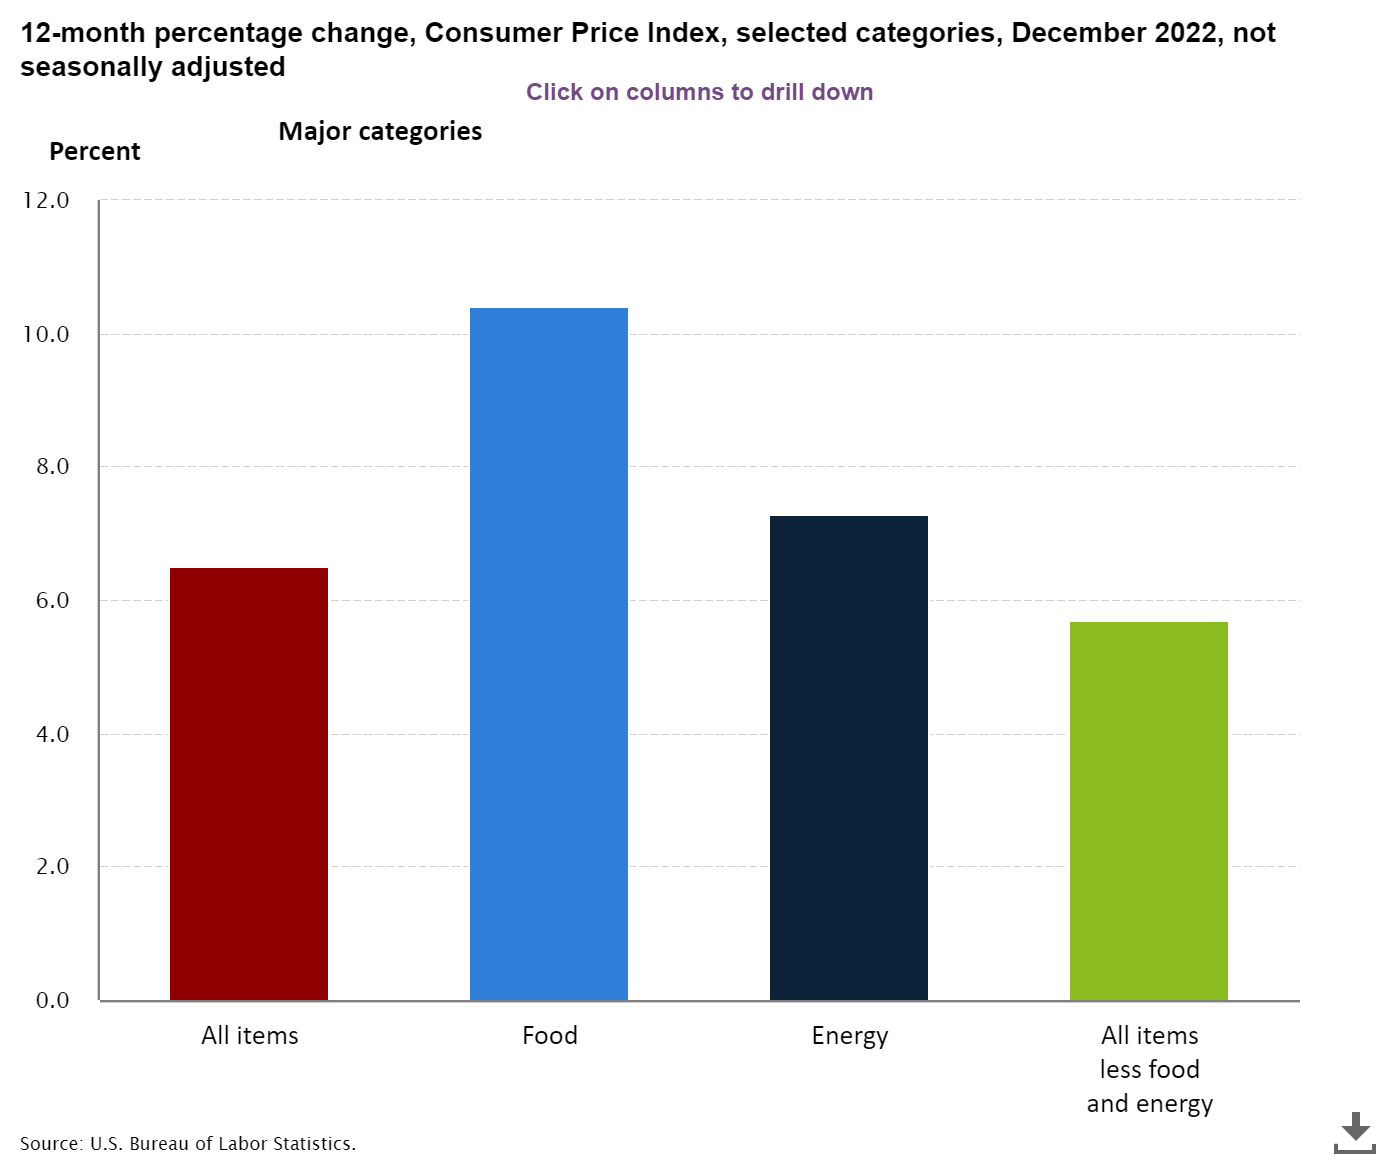
The U.S. Consumer Price Index (CPI) had an over the month decline of 0.1% in December on a seasonally adjusted basis. A drop in gasoline prices was the main contributor for the decrease in overall prices. While gas prices dropped in December, food prices increased as did other things. The index for all items less food and energy rose 0.3% in December. Annual inflation was 6.5% in December, the lowest it has been since October 2021. Food prices lead the annual increase in consumer prices, rising 10.4% over the year. All items less food and energy had a 12-month change of 5.7%, as seen in Exhibit 2. According to the January 12 U.S. Bureau of Labor Statistics CPI release, Phoenix is no longer the metropolitan area with the highest inflation. Prices in Miami rose 9.9% over the year for December while Phoenix prices rose 9.5%. This was still higher than the U.S. at 6.5%, the West at 6.2% or more specifically the Mountain region at 7.4%.
Exhibit 2. U.S. Consumer Price Index, 12-month percentage change, December 2022
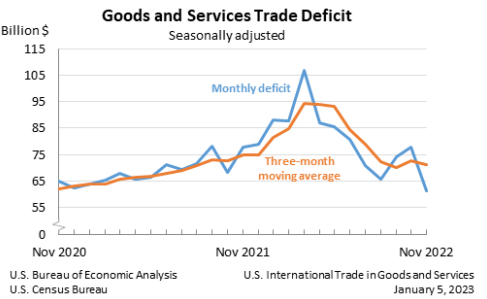
The U.S. trade deficit dropped to $61.5 billion in November, down from the revised October figure of $77.8 billion (Exhibit 3). This is the lowest the deficit has been since September 2020. Both exports and imports were lower for the month. November exports were $5.1 billion less than October while imports declined by $21.5 billion. Year-to-date, the goods and services deficit is 15.7% than the same period in 2021 based on the January 5 joint release from the U.S. Census Bureau and U.S. Bureau of Economic Analysis.
Exhibit 3. U.S. Goods and Services Trade Deficit, November 2022
U.S. total nonfarm employment was up 223,000 in December. Leisure and hospitality, health care, construction and social assistance added the largest number of jobs in December. Average hourly earnings increased 4.6% over the last 12 months according to the January 6 U.S. employment report released by the Bureau of Labor Statistics. The unemployment rate ticked down to 3.5% in December from 3.6% in November (which had been revised). The employment-population ratio increased to 60.1% and the labor force participation rate was 62.3% in December. Both of these measures are still below February 2020 values.
Producer prices in the U.S. declined 0.5% in December on a seasonally adjusted basis. Final demand goods were down 1.6% for the month while final demand services increased 0.1%. The index for final demand increased 6.2% over the last 12 months compared to a 10.0% increase in 2021 based on the January 18 U.S. Bureau of Labor Statistics release.
Arizona job growth was up 3.1% in December. Both the private sector and government had year-over-year job increases for December, according to the Arizona Office of Economic Opportunity January 19 release. Education and health services, Leisure and hospitality, and manufacturing had the biggest job gains from December to December. Information had a loss of 100 jobs during that period. Percent change in employment for Arizona metropolitan areas in December, not seasonally adjusted, was as follows: 4.8% in Flagstaff, 3.3% in Yuma, 3.2% in Phoenix, 2.9% in Prescott, 2.3% in Tucson, 2.0% in Lake Havasu City-Kingman, and 1.2% in Sierra Vista-Douglas. Arizona’s seasonally adjusted unemployment rate was 4.0%, down from 4.1% in November.
There was little change in Arizona job openings, hires, quits, or total separations for November. Though all decreased, rates for Arizona remain higher than the U.S. for all of these indicators. Nationally, there was little or no change according to the State Job Openings and Labor Turnover (JOLTS) January 20 release.
Arizona was one of the top 10 states for population growth between 2021 and 2022, increasing 1.3% according to the Census Bureau annual state population estimates released December 22. Florida was the state with the largest percentage increase, growing by 1.9%, followed by Idaho with 1.8%, South Carolina with 1.7%, Texas with 1.6% and South Dakota at 1.5%. Arizona ranked 8 out of the top 10 for percentage growth, however it was 5th for numeric growth. Texas had the largest increase in the number of residents between 2021 and 2022, followed by Florida, North Carolina, Georgia and Arizona. New York, on the other hand, lost population. It had the biggest decline both numerically and percent. The South and the West were the only regions of the country to experience growth in population. Both the Northeast and Midwest lost population.
U.S. real GDP rose at an annual rate of 2.9% in the fourth quarter 2022 according to the advance estimate released January 26 by the U.S. Bureau of Economic Analysis. In the third quarter 2022 real GDP increased 3.2%. Another estimate based on more complete base data will be released at the end of February.


