
Delaney O’Kray-Murphy, EBRC research economist
Valorie Rice, senior business information specialist
Prarthana Magon, EBRC student researcher
Current data releases as of 19 May 2023
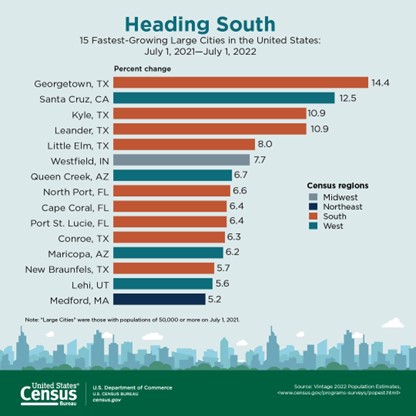
Queen Creek and Maricopa, both within the Phoenix metro area, ranked among the 15 fastest-growing large cities in the nation. Large cities have populations of 50,000 or more, based on the May 18 U.S. Census Bureau population estimate release for cities and towns. Population increases in Texas dominated the top 15 fastest-growth large cities, with six cities taking spots in the rankings. Georgetown, Texas was at the top of the list for growth. All Arizona cities of 50,000 or more had population increases from 2021 to 2022, ranging from 6.7% in Queen Creek to 0.4% in Chandler, based on the Census Bureau estimates. Phoenix occupied the second highest position for the numeric increase among all large cities in the nation, with only Fort Worth, TX, adding a larger number of people. Phoenix remained the fifth largest city in the U.S., and the Phoenix-Mesa-Chandler metro area has now reached the rank of the 10th largest in the U.S. New York holds the top position as the most populous metro area. (Note: EBRC uses population data from the Arizona Office of Economic Opportunity in our indicator tables, which had percent changes slightly higher than those reported by the Census Bureau.)
Unemployment in Arizona set a new series low for the month of April, at 3.4%. The national unemployment rate remains steady, also at 3.4%, as reported May 19 by the Bureau of Labor Statistics. Unemployment rates decreased in 14 states and remained stable in 36 states and the District of Columbia. Arizona was not the only state to set a new series low, as they were joined by Alabama (2.2%), Arkansas (2.8%), Kentucky (3.7%), Maine (2.4%), Maryland (2.5%), Mississippi (3.4%), Ohio (3.7%), West Virginia (3.3%), Ohio (3.7%), West Virginia (3.3%), and Wisconsin (2.4%). Nonfarm payroll employment increased in five states, decreased in one, and was essentially unchanged in the remaining 44. The largest percentage changes increase occurred in Indiana (+0.5%), followed by Arizona, California, and New Jersey (+0.4% each). Arizona did not see yearly or monthly statistically significant seasonally adjusted unemployment rate changes. However, Arizona did see significant monthly and yearly changes in employment at 0.4% and 2.3%, respectively, with employment in April 2023 rising to 3,158,700.
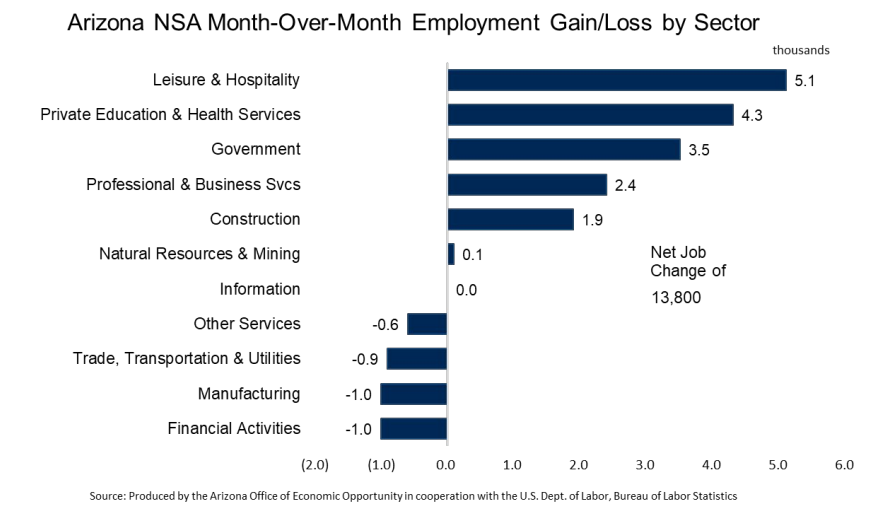
Arizona nonfarm employment increased by 13,800 jobs in April, or 0.4%, not seasonally adjusted. The largest employment gains occurred in leisure & hospitality (5,100); private education & health services (4,300); and government (3,500). Manufacturing (-1,000); financial activities (-1,000); and trade, transportation & utilities (-900) suffered the greatest employment losses. Year-over-year employment increased by 60,700 or 2.0% in April, with the private sector contributing most new jobs (47,000). Private education & health services contributed the most jobs over the year at 25,500, followed by government at 13,700 and leisure & hospitality at 9,800. Employment losses were not as significant as the gains, with other services shrinking by 3,500 and information falling by 1,100. Over the year job gains in Arizona metropolitan areas included 2.0% in Phoenix, 1.9% in Flagstaff, 1.3% in Tucson, 1.2% in Prescott, 1.1% in Lake Havasu City-Kingman, -0.5% in Yuma, and -1.5% in Sierra Vista-Douglas.
While nonfarm jobs increased over the month, the total employment decreased from March to April by 24,800; however, the civilian labor force also decreased by a slightly larger quantity: 26,400. Taken together, it seems employment grew slightly despite the shrinking of the labor force based on the household survey. Year-over-year gains persist in both categories, with the civilian labor force and total employment increasing by 65,400 and 74,600, respectively, since last April. The Arizona unemployment rate for April was 3.4%, a series low. Unemployment rates in Arizona counties were evenly spaced in April with five reporting an increase, five decreasing, and the remaining five having little or no change over the month. Santa Cruz and La Paz counties experienced the greatest shifts, with the former moving from 6.3% to 5.7% and the latter from 4.2% to 4.7% in April. The highest unemployment rate occurred in Yuma County at 9.2%, while Greenlee County saw the lowest at 2.2% (important to note that the population levels and industry mix vary widely between the two). Arizona metropolitan areas had less variance between their month-over-month unemployment rates. Unemployment rates in Phoenix and Tucson were unchanged in April at 2.9% and 3.2%, respectively.
According to the recent release of the Job Openings and Labor Turnover survey in March, 2023, the preliminary count for hires in Arizona fell to 121,000 before seasonal adjustment. This is a decrease from 141,000 in March 2022, indicating a 14.2% decline over the year. Similarly, the number of job openings in the state decreased from 240,000 in March 2022 to 182,000 in March 2023, reflecting a 24.2% drop. In March 2023, the total separations in Arizona, including both voluntary quits and involuntary separations, decreased from 151,000 in March 2022 to 124,000, or 17.9%. This decline was primarily driven by a significant decrease in the number of quits, which dropped by 33.1% over the year, coming in at 85,000. Conversely, the number of layoffs and discharges increased from 18,000 in March 2022 to a preliminary count of 30,000 in March 2023, indicating a 66.7% increase over the year.
The National Compensation Survey’s Employment Cost Index report for the first quarter of 2023 revealed a 1.2% increase in compensation costs for civilian workers in the U.S. during the three-month period ending in March 2023 as reported by the U.S. Bureau of Labor Statistics. Over the 12-month period, compensation costs rose by 4.8%, driven by a 5.0% increase in wages and salaries and a 4.5% increase in benefit costs. In the private industry sector nationwide, compensation costs increased by 4.8% over the year, with wages and salaries rising by 5.1% and benefit costs increasing by 4.3%. State and local government workers across the nation saw a 4.9% increase in compensation costs, with wages and salaries rising by 4.7% and benefit costs increasing by 5.0%. In the Phoenix-Mesa-Scottsdale, AZ metropolitan area, total compensation for private industry workers experienced a significant 4.6% increase in the 12-month period ending in the first quarter of 2023. Additionally, wages and salaries for private industry workers in the region saw a notable 5.2% increase over the same period. The data suggest positive developments in wages, salaries, and benefits, reflecting a tight labor market.
The Consumer Price Index for All Urban Consumers increased by 0.4% in April, seasonally adjusted, following a 0.1% increase in March. On an unadjusted 12-month basis, inflation softened slightly from 5.0% in March to 4.9% in April. Leading the inflationary trend, used cars and trucks saw a notable 4.4% change, entering positive territory for the first time since June 2022. Gasoline (3.0%), medical care commodities (0.5%), shelter (0.4%), and food away from home (0.4%) followed as the next highest contributors. On the other hand, utility (piped) gas service (-4.9%) and fuel oil (-4.5%) served as the largest detractors to the CPI in April. They were followed by electricity (-0.7%), new vehicles (-0.2%), transportation services (-0.2%), and food at home (-0.2%). Over the past 12 months, the food at home index rose 7.1% (not seasonally adjusted), with fruits and vegetables showing a 2% increase and cereals and bakery products rising by 12.4%. The shelter index played a significant role as the main component in the monthly index for all items excluding food and energy, albeit rising at the lowest rate in the past six months at 0.4%. Over the last 12 months, shelter prices rose by 8.1%. Inflation in the Phoenix metropolitan area was 7.4% in April, down from 8.5% in February. It has steadily decreased since August 2022 when it reached 13.0%.
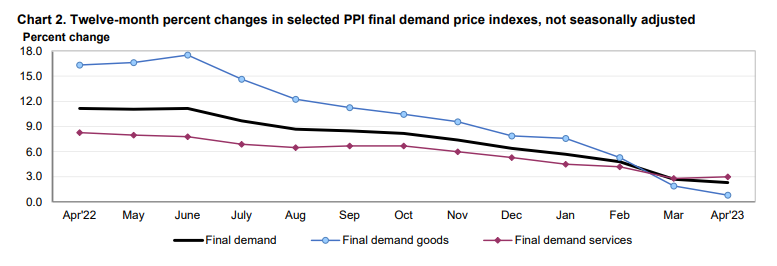
The Producer Price Index (PPI) rebounded in April, showing a turnaround from the previous month’s decrease of 0.4% with an increase of 0.2%, both seasonally adjusted. Additionally, April revealed a 2.3% unadjusted 12-month change in final demand, marking the lowest rate since January 2021. The trend of declining final demand has been consistent since June 2022, when it reached 11.2%. The decrease in energy prices during this period played a significant role in the decline of PPI, with the change in final demand (excluding foods, energy, and trade) dropping from 6.4% in June 2022 to 3.4% in April 2023, both on an unadjusted basis. This more moderate disinflation reflects the notable impact of energy prices on overall demand. In April, energy final demand experienced the highest increase at 0.8%, followed by trade at 0.5% and other at 0.4%. However, two categories, namely transportation and warehousing along with foods, recorded negative price movements, with decreases of 1.7% and 0.5%, respectively. Prices for fresh and dry vegetables, coal, gasoline, and plastic resins and materials increased, while eggs, jet fuel, utility natural gas, meats, and fats and oils all fell.
Arizona public school per pupil current spending increased by 9.4% in the fiscal year 2021, making it among the states with the most significant increases in per pupil spending over the year. The national increase of 6.3% in public school spending per student was the largest fiscal year-to-year increase since 2008, according to the May 18 U.S. Census Bureau release. Public school per student spending in FY2021 increased for every state except Hawaii. Despite the most substantial increase in spending for over a decade, Arizona’s public school per student spending was still among the lowest in the nation for FY2021. At $9,611 for Arizona, only Utah ($9,095) and Idaho ($9,053) spent less per pupil. Nationally, public per pupil spending was $14,347 in FY2021. New York stood at the top of the spending amount, at $25,571. Arizona spent the least per student on instruction, which encompasses salaries, employee benefits, supplies, materials, and contractual services.