

Contributing to this article were EBRC staff members Delaney O’Kray-Murphy, Valorie Rice, and Shaw Zeider along with EBRC student researcher Prarthana Magon.
Current data releases as of 5 May 2023
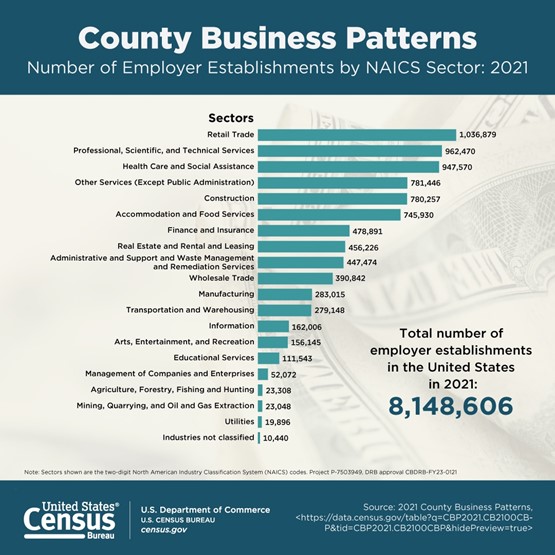
Health care and social assistance was the sector in Arizona with the greatest number of employer establishments for 2021 based on the 2021 County Business Patterns data released on April 27. The second-highest number in Arizona was for professional, scientific, and technical services, followed by retail sales. Retail sales was the top sector for employer establishments in the U.S., with professional, scientific, and technical services second and health care and social assistance third. The total number of employer establishments in Arizona for 2021 rose to 154,759, an increase of 3.3% over 2020. The number of employer establishments in the U.S. increased by 1.9% between 2020 and 2021. An upcoming article will expand upon the number and type of establishments in Arizona and its counties.
House prices in Phoenix and nationwide moderated in February. After seven consecutive months of declining prices, both markets gained on a month-over-month basis. Nationally, on a year-over-year basis, house prices were up 2.0%, while in Phoenix, they were down 2.1%. The April 25th S&P CoreLogic Case-Shiller release indicated seven other metropolitan areas with negative price changes on an annual basis, all of which were in the West: Denver, Las Vegas, Los Angeles, Portland, San Diego, and San Francisco. The metros with the largest annual increases include Miami, Tampa, and Atlanta at 10.8%, 7.7%, and 6.6%, respectively. The largest annual decline in housing prices occurred in San Francisco, at -10.0%.
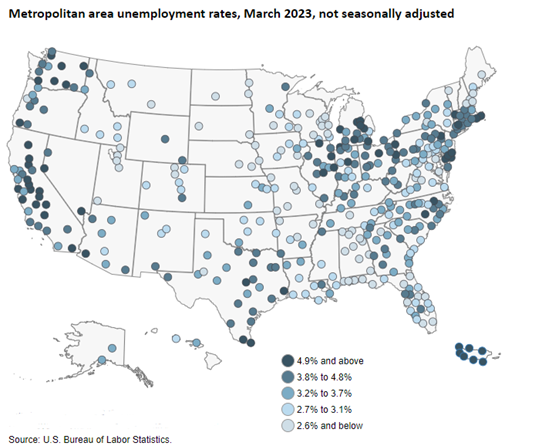
The lowest unemployment rate in Arizona for March took place in Phoenix at 2.9% before seasonal adjustment, placing it below the national unemployment rate of 3.6%. The Bureau of Labor Statistics released March’s metropolitan employment report on May 3rd, noting that Decatur, AL; Huntsville, AL; and Rapid City, SD boasted the lowest rates, each at 1.6%. Conversely, the highest rates were observed in three California metropolitan areas: El Centro at 15.6%, Visalia-Porterville at 11.3%, and Merced at 11.2%. Among Arizona metropolitan areas, Flagstaff decreased by 20 basis points over the month to 3.5%, Prescott increased by 10 to 3.2%, and Sierra-Vista Douglas decreased by 10 to 4%. The remaining areas showed no change: Phoenix-Mesa-Scottsdale at 2.9%, Tucson at 3.2%, and Yuma with the highest rate at 9.1%. Arizona’s civilian labor force decreased by 9,800 individuals from February to March, with most of the decline concentrated between Phoenix-Mesa-Scottsdale and Tucson.
Job openings in the U.S. decreased to 9.6 million in March, marking a decline of 384,000 from the previous month and a significant year-over-year decline of 20.3%, according to the Job Openings and Labor Turnover Survey released on May 2nd 2023. This year-over-year drop indicated the most significant decline in job openings since April 2022 and resulted in a total of 1.6 million fewer job openings than in December 2022. Specifically, job openings decreased in transportation, warehousing, and utilities, but increased in educational services. The number of hires in the U.S. was little changed at 6.1 million in March, with a rate of 4.0%. Hires decreased in real estate and rental and leasing. Total separations, which include quits, layoffs and discharges, and other separations, changed little at 5.9 million in March, with a rate of 3.8% for the fourth consecutive month. Quits remained at 3.9 million, while layoffs and discharges increased to 1.8 million. Layoffs and discharges increased in construction, accommodation and food services, and health care and social assistance.
U.S. total seasonally adjusted nonfarm employment increased by 253,000 in April, according to the May 5th Bureau of Labor Statistics Employment Situation Summary. The overall national unemployment rate remained relatively constant at 3.4%. Although the unemployment rate and the number of unemployed persons (5.7 million) showed little change in April, there was an increase of 346,000 individuals who are not in the labor force but want a job, bringing their total to 5.3 million. These individuals are not counted toward unemployment as they have either not actively sought employment in the past four weeks or were unable to accept a job offer. In April, employment trended upwards in professional, scientific, and technical services (+45,000); professional and business services (+43,000); health care (+40,000); leisure and hospitality (+31,000); social assistance (+25,000); financial activities (+23,000); government employment (+23,000); and mining, quarrying, and oil and gas extraction (+6,000). However, several of these sectors fell behind their average gain of the last six months. Employment in other major industries remained relatively unchanged.
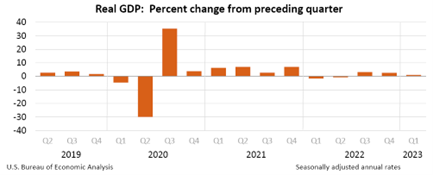
In the first quarter of 2023, the U.S. GDP experienced a modest annual growth rate of 1.1%, marking the lowest increase since the mild recession in the first half of 2022. This observation stems from the advanced national estimate released by the Bureau of Economic Analysis on April 27th. These data reflect a gradual deceleration in economic growth over the past three quarters. The expansion in real GDP was primarily propelled by rising consumer spending, as well as increased spending by both federal and local governments. However, declines in private inventory investment and residential fixed investment offset these gains. Notably, the surge in consumer spending was driven by sectors such as motor vehicles and parts, health care, food services, and accommodations. It is worth mentioning that a considerable portion of the vehicles, engines, and parts involved in this consumption were imported, thus partially negating the overall GDP gain.
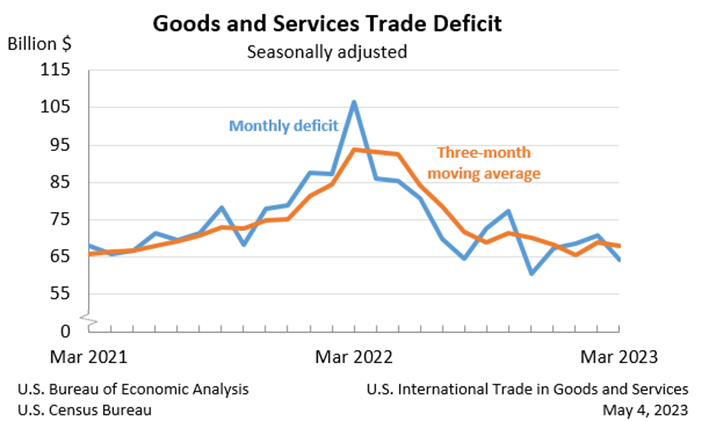
The U.S. trade deficit was $64.2 billion in March, down $6.4 billion from a revised $70.6 billion in February. Year-to-date, the goods and services deficit decreased $77.6 billion, or 27.6 %, from the same period in 2022. Exports increased by 2.1% in March, while imports declined by 0.3%. Exports reached $256.2 billion, and imports hit $320.4 billion, according to the May 4 joint U.S. Census Bureau and U.S. Bureau of Economic Analysis release.
Building permits in March came in strong. The statewide total of 6,525 total building permits issued was the highest since March 2022. Phoenix MSA accounted for 5,359 permits, while Tucson MSA accounted for 752. March has seen a continuation of multi-family building permits comprising the most significant portion of total building permits across the state: 52.6%. In March, multi-family building permits statewide stood at the second highest on record, with only December 2022’s eye-popping figure of 3,639 surpassing March 2023’s 3,429 building permits.


